Is now the riskiest time to be thinking about where to invest your money? In the post below Michael Mahaffey reminds us why risky times such as these are times to be considering gold investment and how much exposure your portfolio should have to gold.
Is now the worst time to invest? I would go further and argue there has never been a riskier juncture in the history of investment at which to put money to work. Let’s take a quick look at some of the typical choices. Corporate bonds. These, on an outright basis, have never offered such a low yield. Implied company-default rates are almost preternaturally low, thus almost certainly not reflecting reality. 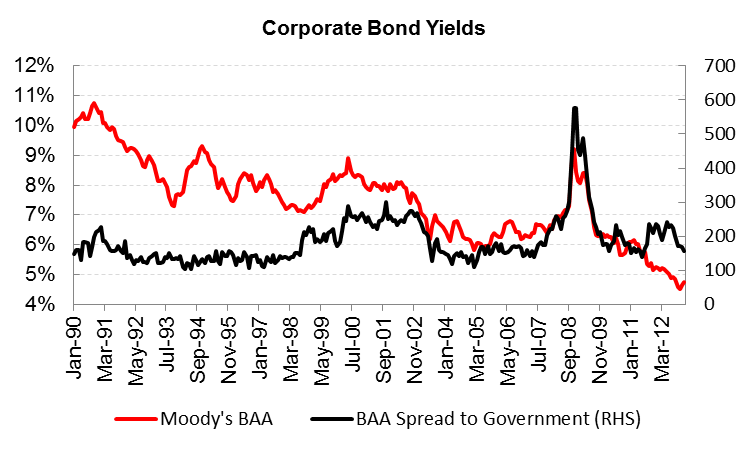
Government bonds and interest-rate swaps, expressing the rates governments can borrow at and the rates banks lend to one another at, are also at or near all-time lows. Being so close to zero, how much lower can they realistically go? 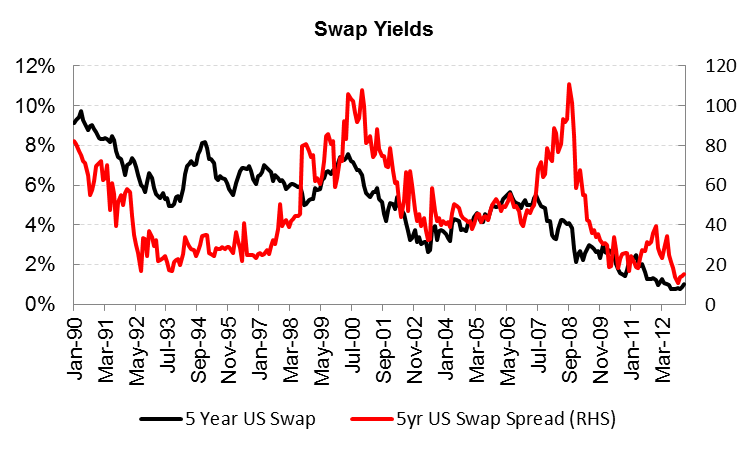
Whether it be corporate or sovereign, you are being given the chance to invest at a 300-year low in yields in most fixed-income markets. In the desperate search for income, you will enjoy an after-inflation guaranteed loss on maturity. Furthermore, with the very real possibility of a bond collapse, especially if the Fed jumps the gun and tries to raise rates too quickly – as happened in 1994 – you could lose 40% of your principal. Equities also look overvalued to offer any chance of delivering a long-term return. 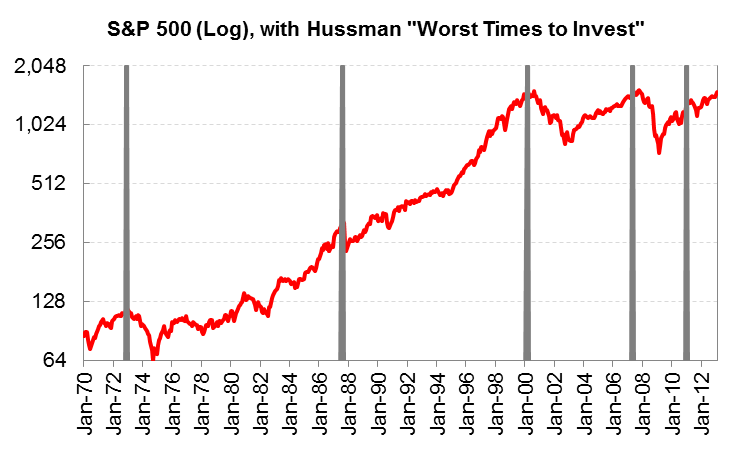
The weekly market comment from the well-known mutual fund manager, John Hussman, tells us that present market conditions in equities now match six other historical occurrences: August 1929, November 1972, August 1987, March 2000, May 2007 and January 2011. All of which were particularly inauspicious times for investing in stocks, and certainly not times to be “rotating” full pelt into them.
Moreover, as Hussman frequently reminds us, we cannot all just rotate into equities, because someone must sell them and either stay in cash or exchange this cash for bonds or another asset. There is always someone who has to hold each equity or bond or unit of cash – as for every seller there is a buyer – it just depends at what price the exchange takes place. Now, many investors are moving into equities at a price which implies they have very low odds of ultimately generating a positive real return.
Of course it would be hard to imagine that we could really have a return to growth when we have a debt mountain that keeps growing in almost every country. The US debt ceiling, for example, will soon have to be raised again. 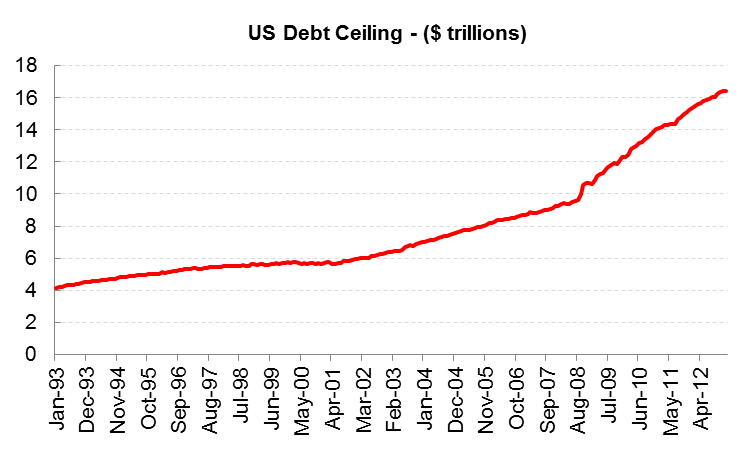
And how is cash likely to fare in the coming years? From the Zeal Intelligence Newsletter:
“The inimitable Peter Schiff, the hard core contrarian and elite fund manager, discussed the results of an inflation study done by his firm Euro Pacific Capital. His hard data found the Bureau of Labor Statistics’ calculation methodologies for the CPI seriously flawed. Euro Pacific’s researchers built their own basket of 20 goods and services in the CPI. They found that it only increased 5% faster than the CPI itself from 1970 to 1980. The CPI was honest then. But between 2002 and 2012, the prices of this same basket soared61% faster than the CPI! Schiff believes the true inflation rate in the US is 7% to 9%, and heading higher.”
Indeed, our tongue-in-cheek James Bond Index arrives at the same 7% rate.
The fact is we all know that inflation is NOT what the government would like us to believe, and whether it is 5, 7 or 10% depends on your lifestyle – but it is not 2%.
Obviously with inflation at 5-10% – and looking like it could go yet higher if monetary velocity picks up – holding cash is a difficult investment-choice right now. In fact we would argue cash is not king: cash is dangerous.
How about gold? Well, sentiment has very quickly changed against it. Last week there were at least five bearish articles on gold. Leading the pack was Credit Suisse’s, Gold: The Beginning of the End of an Era from Credit Suisse. There was also a tempering of bullishness from Citi in a note, Gold Schizophrenia.
So bonds and equities worldwide are in nosebleed territory. And gold, apparently, has “peaked”. As the oil/gold ratio is at 17 and gold/copper is 4.4 – close to their long-term averages – we would then, according to this thought process, have to say that all commodities have “peaked”.
But holding cash is going to cost you 5-10% a year in purchasing power. So I think I might be right in suggesting this is the worst time in history to invest, and certainly the riskiest I have known in 30 years.
Dylan Grice, until recently of SocGen, introduced the so-called “cockroach” portfolio that would “survive” the nuclear war. This is also known as the permanent portfolio, and it is something we have written about before as well.
The basic premise is a portfolio consisting of 25% gold, 25% equities,25% bonds and 25% cash. However, while I still very much advocate this type of portfolio, the discussion above would lead me to be cautious. Indeed, given the egregiously low yields, I would eliminate the bond constituent altogether and instead aim for: 33% cash, 33% well-picked equities, and 33% gold. (After doing that I would buy some short-dated put options (ie downside protection) on the equities, and keep rolling them as I see fit.)
Why raise the gold portion? Of course I might have some bias, as I have every year since 2001, but I feel I need to hold a high percentage of gold, ie 30% or so, in my portfolio until circumstances dictate that it is expensive relative to the monetary base and other assets and/or the global economy has reduced its debt burdens.
On that note, gold currently is out of favour. The Hulbert Gold Sentiment Indicator, which tracks the bullishness of gold newsletter writers, has turned down to 6%, near its recent lows. Furthermore, the Daily Sentiment Indicator (DSI, charts below), which tracks the sentiment of traders in gold futures, is also bobbing around a low level. Of course, as a long-in-the-tooth trader, I prefer to see lots of bearish investors if I am bullish: no one makes money in the herd for long.
To illustrate gold’s recent falling out of favour, the chart below shows the net long speculator positions in gold futures (according to the CFTC) are falling and are low compared to the last 3 years. 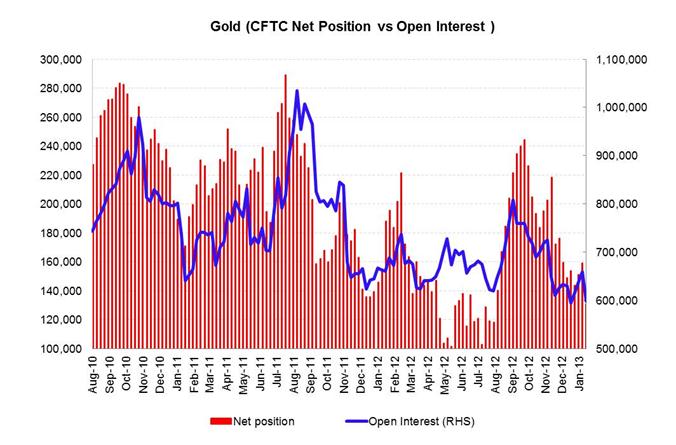
And the DSI confirms this lack of enthusiasm for gold: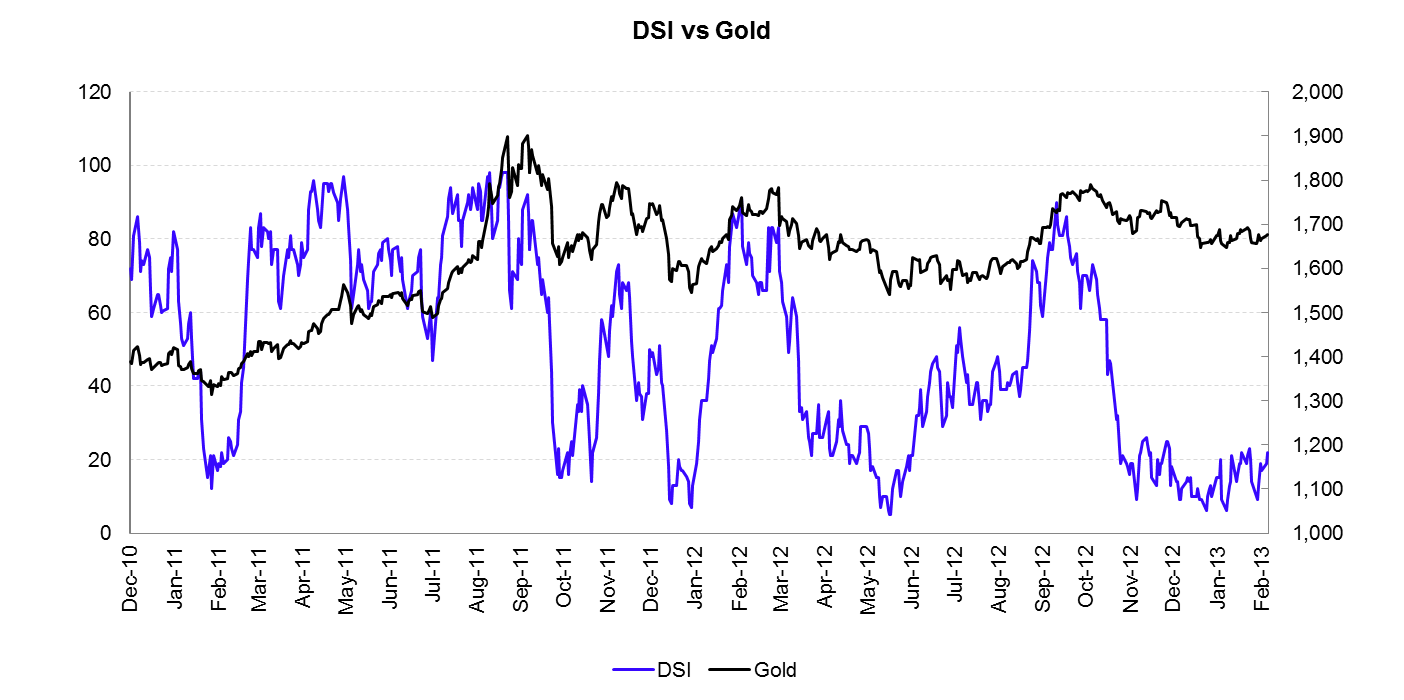
While I do not usually comment on other’s work on gold, I couldn’t help thinking that Credit Suisse (CS) were particularly one-sided. I have never seen a serious analysis of gold being rich or cheap without a comparison to the monetary base – given the latter’s explosion in recent years gold is undeniably cheap on this basis.
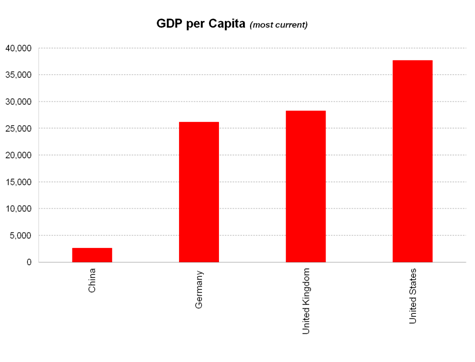
However, there was no mention of Chinese GDP per capita growing at 13% a year for the last 11 years in the CS note, roughly the same growth rate as gold, with China now the largest producer and importer of gold. Is China GDP per capita going to stop here, at $2,500, with US GDP per capita at $35,000? 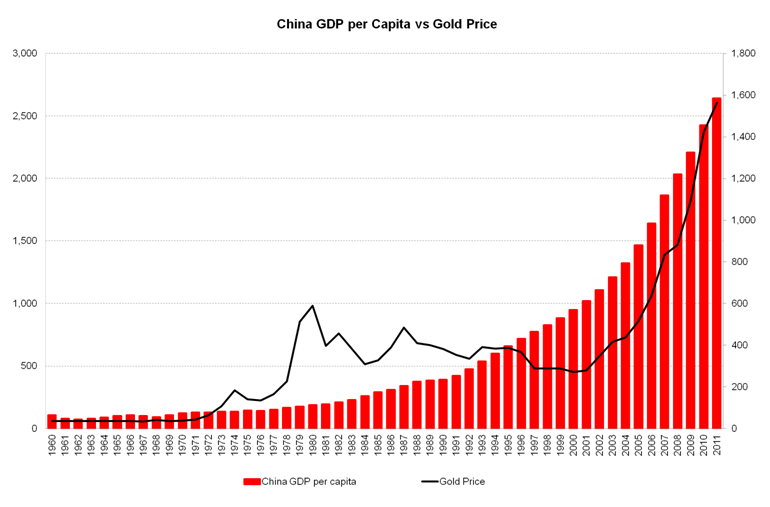
Another important point in this discussion about gold is its production. Gold stocks, as shown in the chart below of GDX, have gone nowhere for six years. This is because of the simple fact they do not make any money at the current gold price. Their margins are wafer thin if they exist at all. Projects are being delayed everywhere due to too high capex. It doesn’t take a rocket scientist to realise that this will lead to a huge production fall off very soon. Indeed, the Canadian bank, National Bank Financial, put out a report detailing just that last week: The Gold Production Cliff. 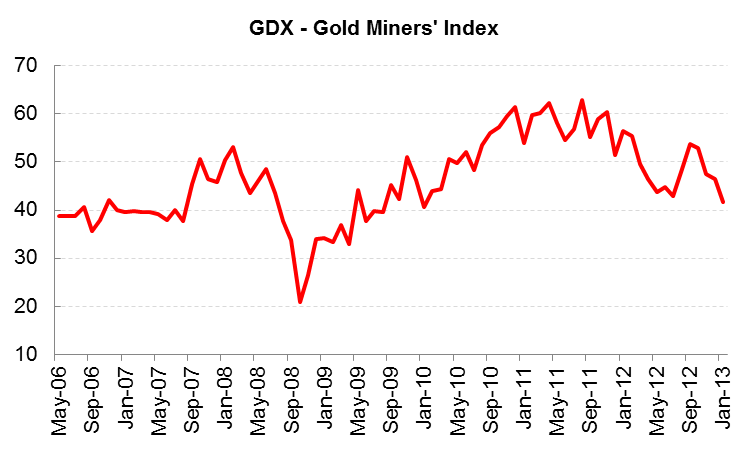
It’s rare for a commodity that is unprofitable to mine at $1,650 dollars an ounce to continue to be mined at that price. Producers will close production down and wait. Finally, I’d mention that gold now has the hallmarks of promising price action. Our Trend Intensity Index, in the chart below, is very low, meaning gold is ‘trend ready’, ie poised for a break out in price. Although gold’s performance has been lacklustre of late, given the negative sentiment and the seeming belief that we are returning to some sort of normality in global growth, I am surprised gold is not lower. I believe this shows gold is well supported, and I expect the break-out in price to be higher.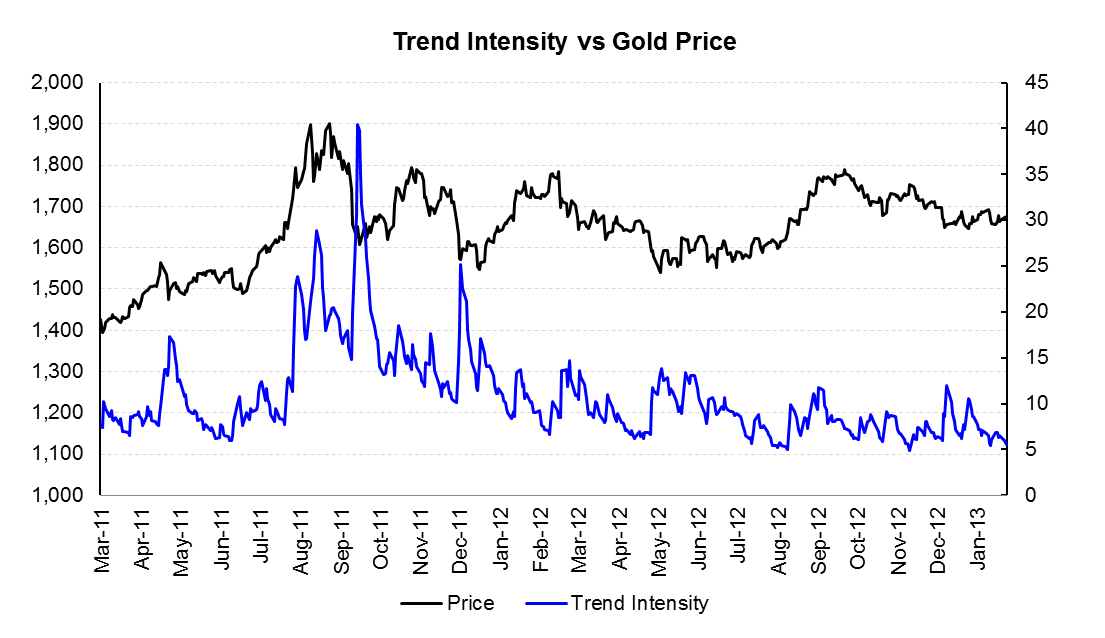
My view of the future is not good. I see an indebtedness worldwide that is only being addressed by money printing. I see growth only being ‘achieved’ by yet more debt. The lies about inflation are a disgrace. Levels of complacency in asset markets and policymakers’ ability to deal with crises abound like 2007.
I cannot think of not owning a significant portion of gold in my portfolio. It would go against all that I have learnt in 30 years, and all that I will worry about for the next 30 years.
Please Note: Information published here is provided to aid your thinking and investment decisions, not lead them. You should independently decide the best place for your money, and any investment decision you make is done so at your own risk. Data included here within may already be out of date.
- English (UK)
- English (India)
- English (Canada)
- English (Australia)
- English (South Africa)
- English (Philippines)
- English (Nigeria)
- Deutsch
- Español (España)
- Español (México)
- Français
- Italiano
- Nederlands
- Português (Portugal)
- Polski
- Português (Brasil)
- Русский
- Türkçe
- العربية
- Ελληνικά
- Svenska
- Suomi
- עברית
- 日本語
- 한국어
- 简体中文
- 繁體中文
- Bahasa Indonesia
- Bahasa Melayu
- ไทย
- Tiếng Việt
- हिंदी
Guest Post: Risky, Riskier, And The Riskiest
Published 02/07/2013, 07:13 AM
Updated 05/14/2017, 06:45 AM
Guest Post: Risky, Riskier, And The Riskiest
3rd party Ad. Not an offer or recommendation by Investing.com. See disclosure here or
remove ads
.
Latest comments
Install Our App
Risk Disclosure: Trading in financial instruments and/or cryptocurrencies involves high risks including the risk of losing some, or all, of your investment amount, and may not be suitable for all investors. Prices of cryptocurrencies are extremely volatile and may be affected by external factors such as financial, regulatory or political events. Trading on margin increases the financial risks.
Before deciding to trade in financial instrument or cryptocurrencies you should be fully informed of the risks and costs associated with trading the financial markets, carefully consider your investment objectives, level of experience, and risk appetite, and seek professional advice where needed.
Fusion Media would like to remind you that the data contained in this website is not necessarily real-time nor accurate. The data and prices on the website are not necessarily provided by any market or exchange, but may be provided by market makers, and so prices may not be accurate and may differ from the actual price at any given market, meaning prices are indicative and not appropriate for trading purposes. Fusion Media and any provider of the data contained in this website will not accept liability for any loss or damage as a result of your trading, or your reliance on the information contained within this website.
It is prohibited to use, store, reproduce, display, modify, transmit or distribute the data contained in this website without the explicit prior written permission of Fusion Media and/or the data provider. All intellectual property rights are reserved by the providers and/or the exchange providing the data contained in this website.
Fusion Media may be compensated by the advertisers that appear on the website, based on your interaction with the advertisements or advertisers.
© 2007-2024 - Fusion Media Limited. All Rights Reserved.
