It depends upon your perspective and the markets you follow …
Perspective
- The global economy is drowning in debt – $230 Trillion and counting – that will not be repaid at current value. Expect hyperinflation or outright default.
- Negative Interest Rates on $13 Trillion in sovereign debt are a sign of failure by central banks, governments, and Keynesian economists.
- Pension plans and savers are hurt by low and negative interest rates. They have been sacrificed for the continued levitation in the stock and bond markets.
- All of the above indicate a correction and possible collapse are coming. Perhaps it began this month, September 2016.
- The charts of six markets tell the story.
Current Highs That Are Worrisome
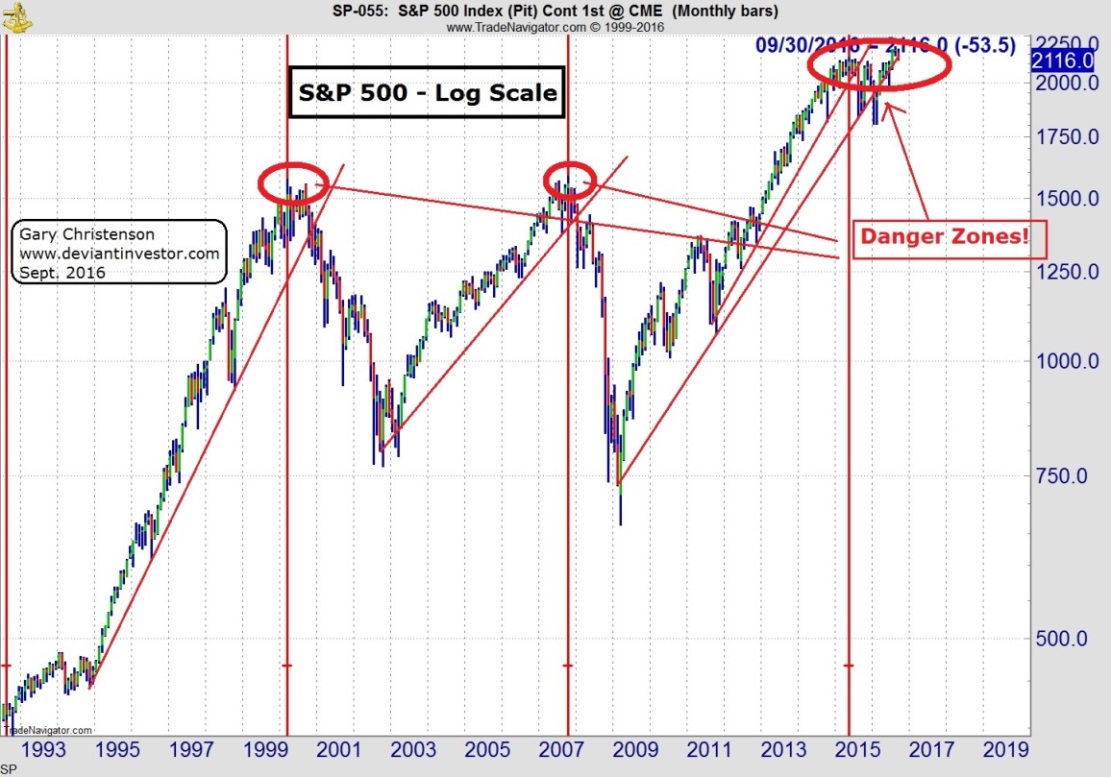
Note the circled S&P 500 highs approximately every 91 months and the dangerous breakdown points.
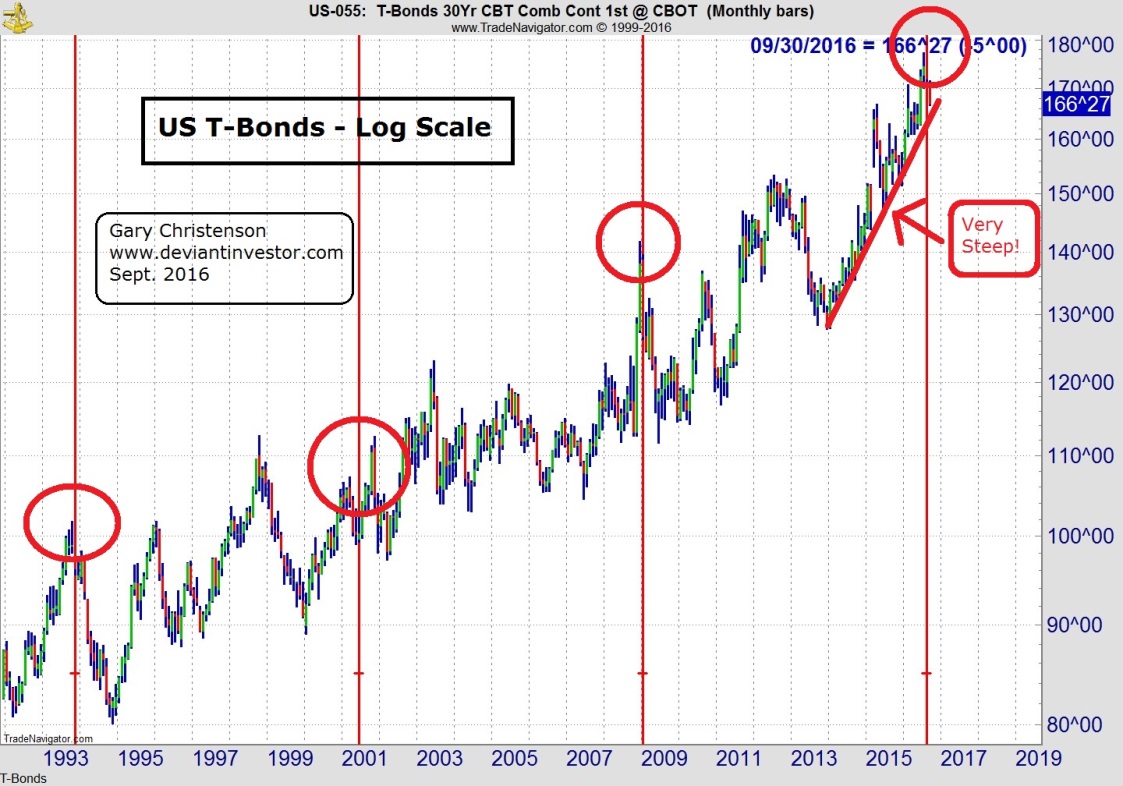
Note the circled T-Bond highs approximately every 91 months. The global bond markets are in a huge bubble, as indicated by negative interest rates, that has lasted over 30 years. “Investors” pay for the privilege of lending money to insolvent governments that will repay, if at all, in devalued currency units.
It is a bubble!
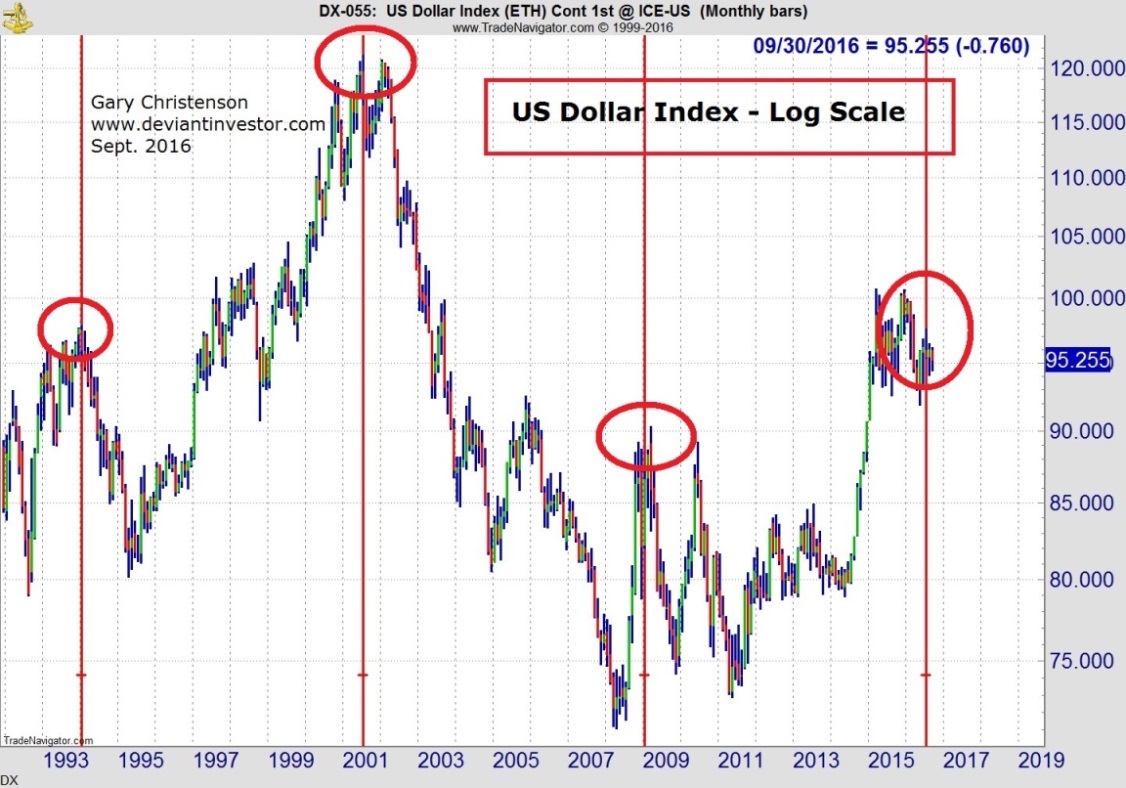
The US dollar has peaked approximately every 90 months. The next big move could be down.
Recent Lows That Should Produce Massive Rallies
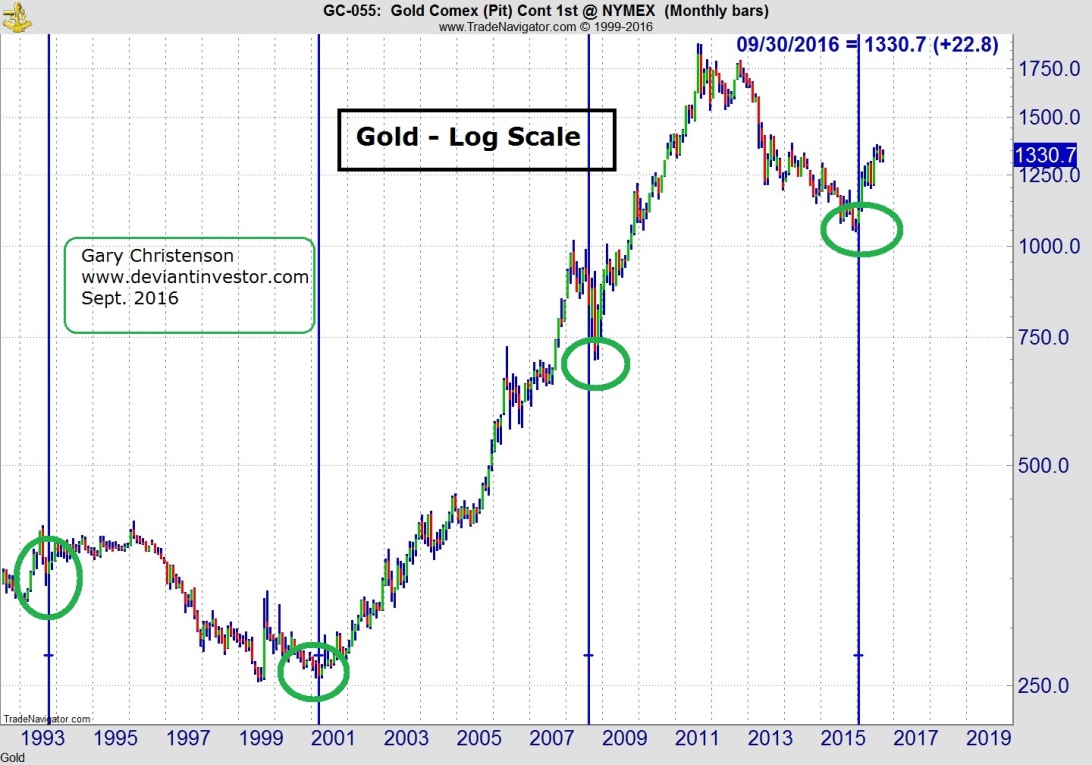
Gold hit lows approximately every 89 months. The rally from the December 2015 low has been impressive. Given the likelihood of corrections and/or crashes in stocks, bonds, and the dollar, gold prices should rally further.
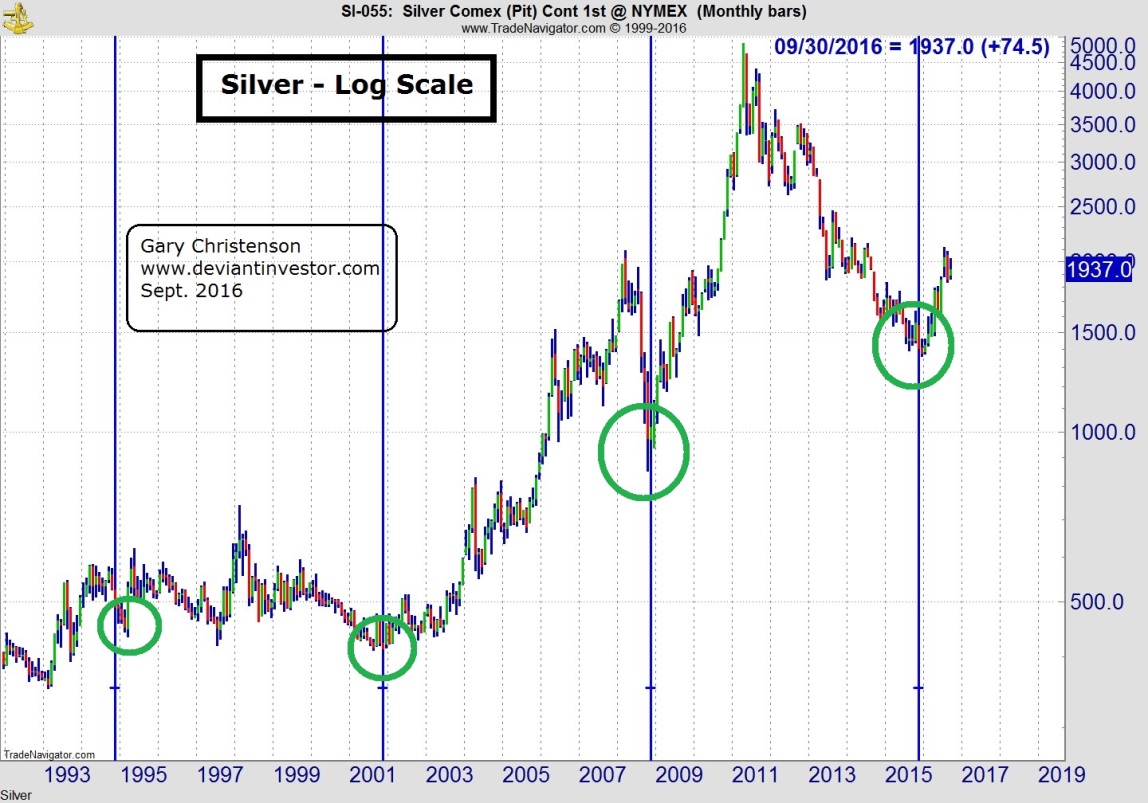
Silver has bottomed approximately every 84 months and tells the same story as gold. The rally from the December 2015 low seems likely to push upward long and hard. If the next low occurs in late 2022 to early 2023 (Dec. 2015 plus seven years) a cycle high could occur early next decade. Considerable price appreciation between now and 2020-2022 seems likely, especially considering the upcoming corrections and/or crashes in stocks, bonds, and currencies.
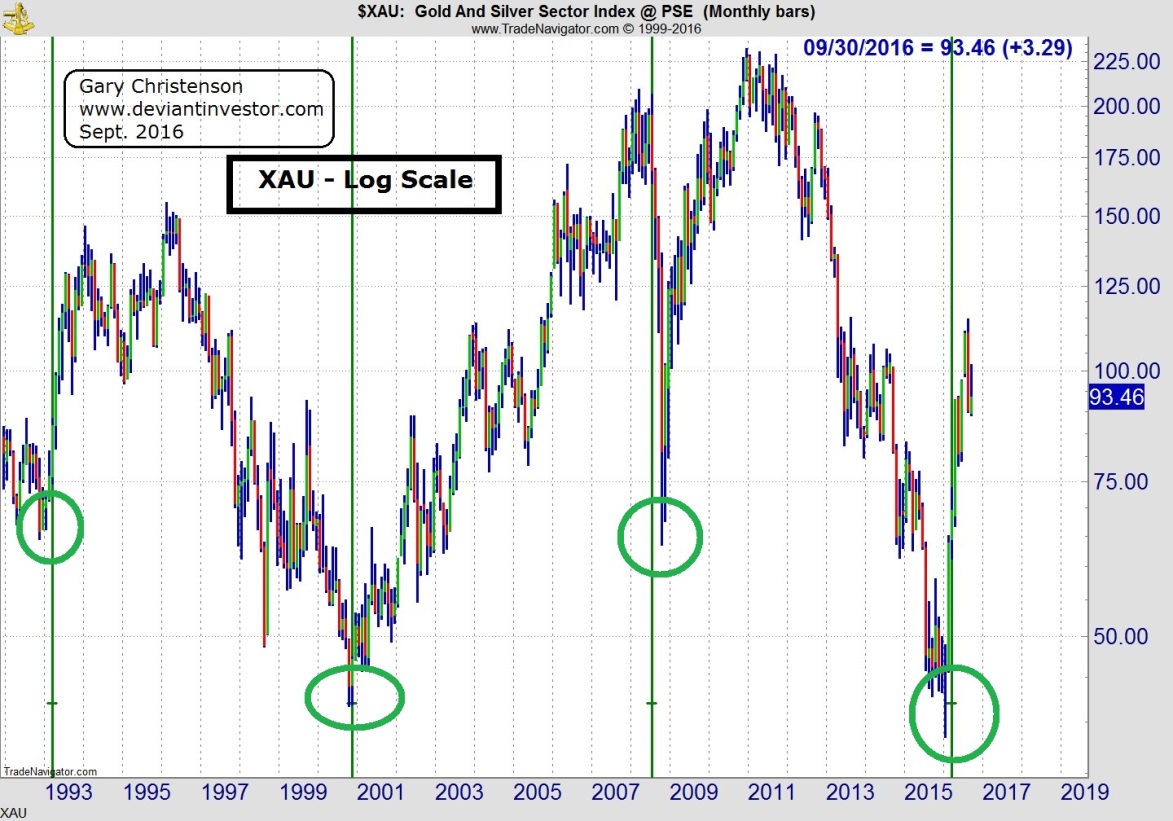
Lows in the XAU – an index of gold stocks – have occurred approximately every 92 months. Expect gold and silver stocks to rally for several years.
CONCLUSIONS
- Central banks have levitated stocks and bonds for decades.
- Cycles indicate that the approximate 7 – 8 year peaks in the S&P, T-Bonds, and the Dollar have occurred or are happening about now. The next major move is more likely DOWN THAN UP.
- Perhaps central banks and the financial elite can levitate the stock and bond markets for another two months in their attempt to elect HRC. The near 400 point drop in the Dow on Sept. 9 (this was written on Sept. 10) suggests they might not levitate those markets long enough for the status quo to survive an honest election.
- Gold, silver and their stocks bottomed approximately nine months ago and have rallied nicely since then. Expect those rallies to continue for several years, perhaps into early next decade.
- Gold, silver,and their stocks will either rally considerably, or incredibly, depending upon central bank insanity, more QE, helicopter money, accidents, and currency devaluations. Remember, Argentina hyperinflated over one trillion to one, compared to the US dollar, in the past 70 years. Many other countries have similarly hyperinflated. It could happen in your country also.
The S&P, T-Bonds and the Dollar index look like candidates for the Great Collapse.
Gold, silver and their stocks look like candidates for the Grand Ascension.
