I. Goodhart’s Law
“When a measure becomes a target, it ceases to be a good measure.”
– Charles Goodhart
When it was first introduced in 1975, Goodhart’s Law focused mainly on social and economic measures. Since then, many financial market indicators have lost their forecasting power and succumbed to Goodhart’s Law. Nevertheless, Goodhart’s Law in no way depreciates the value and importance of market indicators; it simply means that investors are unlikely to be able to consistently generate abnormal returns over time using popular measures that are publicly available to the entire market. A clear example is what has happened to the CBOE Volatility Index, or VIX.
II. The Volatility Index
The Volatility Index (VIX) was a groundbreaking product when the Chicago Board Options Exchange (CBOE) released it in 1993. Also referred to as the fear index, VIX measures the expected underlying volatility in the S&P 500 over the next 30-day period on a real-time basis. Using various measures of VIX such as the two-week mean, the 30-day rolling standard deviation, etc., VIX traders and portfolio managers developed strategies that were initially profitable. However, over time it has become extremely difficult to profitably forecast the market by simply observing the movement in VIX.
While the history of the VIX demonstrates how a market gauge lost its predictive power once it caught investors’ attention, the CBOE Low Volatility Index, LOVOL, provides an even better illustration of how an indicator can lose its forward-looking power very quickly. CBOE began calculating the Low Volatility Index on March 21, 2006, and started disseminating LOVOL data on November 30, 2012. The forecasting ability of LOVOL immediately plunged to almost zero within a month. In fact, Goodhart’s Law has captured nearly all of the CBOE volatility indexes as prisoners. These fallen angels are no longer useful tools for forecasting purposes.
Another prominent index, developed in the late 1960s, that uses extremes in its value to signal that a market may soon change direction is the Arms Index (TRIN). As predicted by Goodhart’s Law, while technical indicators such as TRIN were able to successfully predict market returns in the past, their loss of forecasting power was only a matter of time when every technician used these ratios for trading purposes. Even the Federal Reserve was no exception. The pre-FOMC announcement drift was found to explain the equity premium puzzle in 2011. But this 24-hour window disappeared soon after the research was published.
III. Investors Beware
On one hand, Goodhart’s Law teaches us that a smart investor should not rely on any single factor known by the general public to be “powerful”; on the other hand, it does not negate the significance of any indicator.
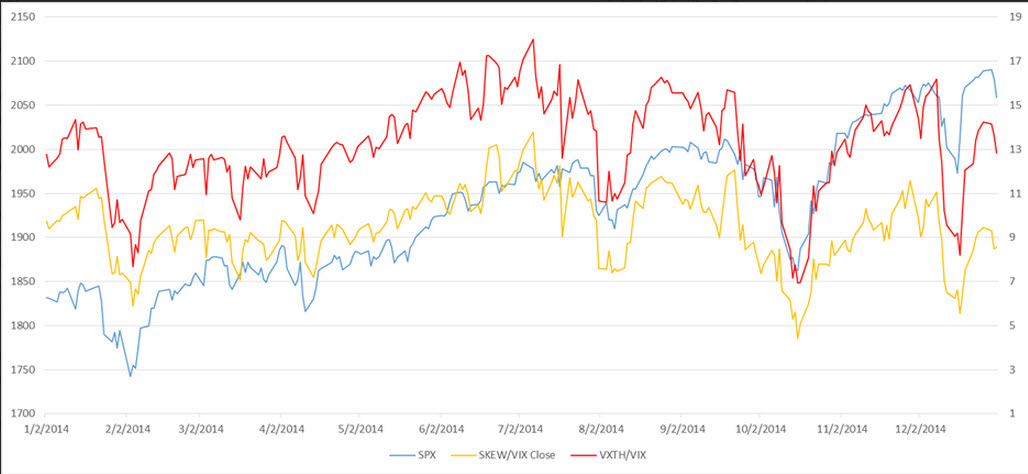
The following figure is a ratio brought up by Chairman and Chief Investment Officer David Kotok of Cumberland Advisors. The CBOE SKEW Index measures S&P 500 tail risk, while the VXTH Index hedges “black swan” events such as Black Monday in 1987. Lagging and scaling both indexes by the lagged VIX, we are able to track the daily SPX with a correlation that can top 90%, comparable to the correlation between the S&P 500 and GDP. Nonetheless, a high correlation is not necessarily equivalent to strong forecasting power. While one could use this chart for long-term investing strategy, the accuracy of using these daily ratios to predict the daily market movement is approximately 51%, not economically significant enough for forecasting purpose.

Figure 1. Correlations between SPX and Volatility Indexes
IV. Conclusion
The list of captives of Goodhart’s Law is clearly longer than just the indicators mentioned above. High-quality research should be able to produce positive abnormal returns as long as there is information that can be exploited; however, superior research alone is no longer synonymous with outperformance – time is also of the essence. Because of technological innovation in financial markets, the time frame in which Goodhart’s law operates today is much shorter than it was in earlier decades. Just as Moore’s Law predicts that chip performance will double every 18 months, investing methodologies must continually evolve in order to remain profitable, due to Goodhart’s Law.
