Once again our microphones have picked up some prudent Gold-oriented chatter, in this instance a rather contested conversation from a cambio somewhere in Switzerland's canton of Ticino:
"One Swiss Franc, signore? That'll be $1.12."
... "What? When I came here in 1972 with my Auntie Grizelda it was only 25¢."
"Sorry signore, but your Auntie, she dates from your Gold Standard; $1.12 please."
... "But this is highway robbery!"
"Autostrada, please signore. $1.12 of your debased currency and you can have the Franc."
... "Forget it. Where's an ATM?"
"At the bank just there on the square, signore."
... "Grazy"
"It requires a two-Franc coin deposit, signore."
... "Aggghhh!"
And yet these days, $1.12 for one Swiss Franc is comparatively reasonable, ('twas as high as $1.41 back in August 2011), given the desired and recently reiterated extent of the Banca Nazionale Svizzera to keep the Franc "soft-pegged" to the Euro, which itself yesterday (Friday) hit its highest level (1.3834) against the Dollar since 09 November 2011: Gold back on that date settled at 1769.7. Because of the "peg", so too did the Franc on Thursday trade at its most dear price (1.1253) to the Dollar since 07 November 2011: Gold back on that date settled at 1796.9. Meanwhile the Dollar Index itself fell yesterday to its lowest level (79.060) since 01 February 2013: Gold back on that date settled at 1668.5.
It does therefore beg the question: "What the deuce are we doing down here at 1352.3?"
Earlier in the week, I swerved passed an Internet graphic of one of our most favourite and telling measures for establishing a fairly reasonable and at times quite consistent valuation for Gold: the growth in StateSide M2 since '81. Curious to confirm yet again that upon which we occasionly herein display from various starting points, I calculated the 1981 average of Gold's 756 daily data points for each high, low and close, the result being $464/oz. Following that, 'twas over to the St. Louis Fed's "FRED" data to calculate the average level of StateSide M2 during 1981, that result being $1.679T.
Today M2 is $10.970T, an increase since 1981 of 553%. Applying same increase from Gold's average price in 1981 puts it today at $2,566/oz. Again, what are we doing down here at $1,352/oz. indeed. Oh to simply regress back up to that M2-comparative mean, eh?. (Which in turn to then overshoot by current deviation of same would put price at $3,790/oz ... just sayin').
As lowly as the 1300s may be, Gold has strung together a couple of good weeks, the 10-trading day period's low-to-high being a run of +8%, in fact leading to a 20-day high (1356) yesterday. Still, as we see below per Gold's weekly bars, the young parabolic Short trend is but three red dots old. The hurdle to flip such trend to Long within the ensuing week is 1420, which whilst seemingly a bit of a stretch, ought be contextually considered as possible given that Gold's weighted-average weekly trading range, (the distance between intra-week low and high) is currently 64 points, and thus that 1420 level is only 68 points above the current price of 1352: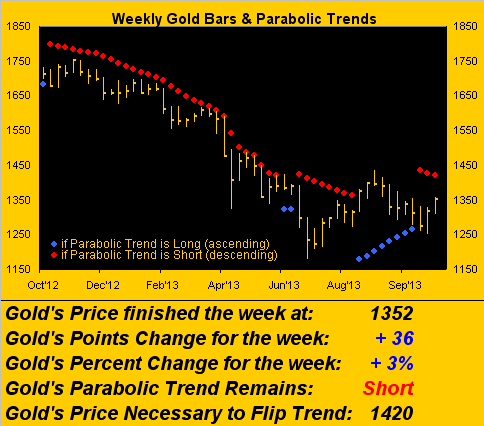
In noting above that a move up through 1420 in the new week is a "bit of a stretch", 'tis simply with some caution I note that Gold very short-term is due for some natural ebb within its flow, such that we may first get a modicum of price retrenchment en route to moving higher. We'll graphically display that rationale in a sec, but let's first consider the following two-panel chart suggestive that more broadly Gold is turning the tide to still higher levels.
Below on the left we've Gold's daily bars for the last 21 trading days (one month), the slope of the linear regression diagonal trendline having turned positive on Thursday, as preceded by the baby blue dots having already been in ascent from better than a week ago. Judiciously assessing the turning points of the "Baby Blues" in concert with prudent cash management can be rewarding as you may discern: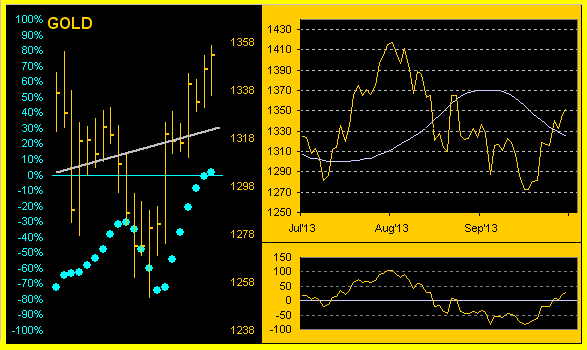
Above on the right we've Gold's daily closing prices from three months ago-to-date, juxtaposed with the smooth, pearly valuation line that is structured from the comparative movements in the BEGOS markets complex (Bond/Euro/Gold/Oil/S&P). Gold's price having penetrated that valuation line to the upside we consider as a harbinger of higher levels, (the oscillator at the foot of the chart being the distance of price from value), albeit as noted, some retrenchment may first be in order. And thus...
To wit this second two panel graphic. In this case on the left below we've the familiar chart of Gold's 10-day Market Profile, which spans that two-week period's entire trading range, the length of the horizontal price bars determined by the volume of contracts traded at each price. The white bar near the top of the chart is yesterday's closing level of 1352. Recall from a week ago the call for "All those in favour of Gold not returning to the 1200s say AYE!"? Brilliant. We now look for any near-term retrenchment to be supported by that longest of apices near the center of the chart at 1317.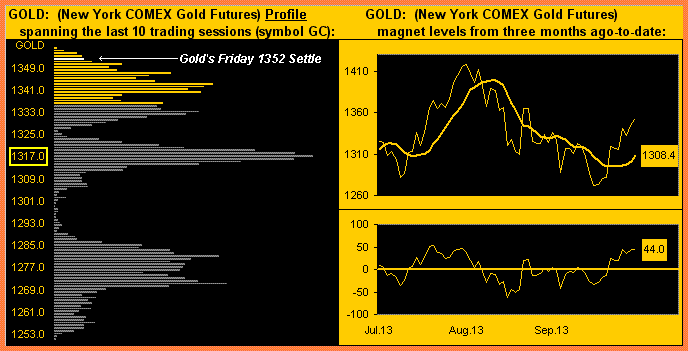
As to why the notion for some retrenchment, on the right above we've the Market Magnets for Gold. Its closing price line is, of course, identical to that shown above in the three-month valuation chart. But in this case, we've a thick line which each day is the volume-weighted average price of all those bars at that time making up the 10-day profile panel. Thus on the magnets chart, the number in the Gold box (1308.4) is the current volume-weighted average profile price. And if you look at the oscillator beneath the chart of price-less-magnet, that distance of 44.0 points appears excessive. Given that price generally returns to the magnet is why we've the notion for at least a bit of near-term retrenchment, again ideally not below the encircled apex 1317 level in the profile chart.
As noted, 'tis certainly been a very good two weeks for Gold. Again, the two quantitative readings to which we're cautious through here are the weekly parabolic trend's being Short and the distance of price above its magnet being somewhat disproportionate to the norm. To be sure -- and as we've been contemplating in recent missives -- we may well look back at these past few months as marking the Big Turn for Gold's renewed surge to materially higher levels, in which case such near-term concern over a pittance of pending pullback will, in hindsight, appear as mere piffle. I thus shan't sell my Gold in retrenchment and would rather take such opportunity to embrace more.
Either way, Gold is clearly far more in play on a daily basis than 'twas one year ago. This next graphic depicts by dots Gold's daily trading range as a percentage of each day's low-to-high for the past year. (Note: there've been some five days exceeding the 5% scaling maximum we've imposed to keep the chart in context). The area encircled in purple shows us how often Gold's daily ranginess used to be regularly contained in the 0.5%-to-1.5% area until price's bottom fell out last April, the daily ranges since then having become less normalized and more scattered...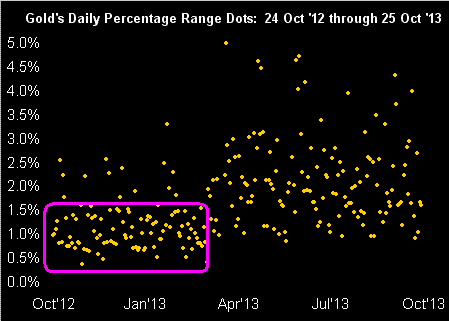
...which in turn suggests the Bears may be losing their "control" over the market.
Losing control, barring one's having the millisecond snap reflexes of a Formula One driver to somehow regain tyre adhesion despite all four wheels being off of the ground, inherently leads to being out of control. That's how I see the S&P 500 right now. Yes, as we can clearly see below, both the S&P and Gold have been on the rise in positive correlation over the past two weeks: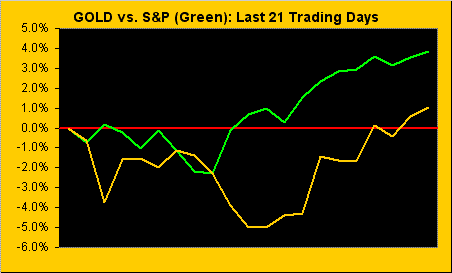
But back in The Gold Update of 27 July, we penned: "At 1400 the S&P was already getting pricey; at 1500 ‘twas clearly overbought by any host of textbook technical studies; at 1600 it rightly became John McEnroe’s You canNOT be SERious!; and now its knocking on the door of 1700 is beyond buffoonery." Frankly, at this point with the S&P at 1759 and a stone's throw away from 1800, my Funkin' Wagnalls thesaurus has run out of synonyms, suffice to say the following:
Extrapolating the S&P's year-to-date growth rate of 23.39% will put its closing level above 2000 on 10 April. "You hoid it here foist!"
"Are you actually predicting that, mmb?"
Why should it not happen, Squire? We've well-hashed through it in many-a-missive: the useless beyond overbought technicals, the meaningless dearth of comparable earnings growth, the sexyless 10-year Treasury Note yield of 2.503% vs. the S&P's 2.038%, even the feckless sputtering of our Economic Barometer since mid-year. None of such logic is relevant anymore. The ongoing pattern of Quantitative Easing -- now perhaps sans taper through 2014 -- is the entire foundation of the S&P's glittering tower. And yet, as the market is never wrong, there is one thing it may be rightly telling us: inflation with far more material impact is coming, the Dollar debasement therein unequivocally to redound positively for Gold.
To answer Squire's question, no, 'tis not a prediction, an S&P at 2000 by April. A lot can happen between now and then and a tower initially constructed back in 1957, and throughout the QE of recent years almost entirely reinforced by paper re-bar, can only stand for so long. (As a time-tested comparative aside: the Egyptians were using Gold bars as a foundational medium of exchange back in 4000 BC).
And speaking of Across-the-Pond, Europe continues to yo-yo: Spain has apparently emerged from a two-year recession in the third quarter, but EuroZone services and manufacturing activities were reported as unexpectedly having slowed, whilst the UK economic recovery has gathered pace per its own economy expanding 0.8%, but Italy’s consumer confidence has taken a turn for the worse.
Nevertheless, the EuroCurrencies are relatively (frightfully?) strong against the Dollar, and if you're tenaciously set on taking that holiday skiing spree to the Alps, as we opened this piece with Switzerland, 'tis thus fitting to close with it, just in case you think you'll be traveling through there on the cheap. This image of the Agip petrol station in Boeuferrant-à-Monthey sports the following per litre prices (SFr):
Let's do the math: SFr1.729/litre x 3.78541 litres/per gallon = SFr6.545/gallon x $1.1204/SFr = $7.73/gallon. Then add on those ghastly forex transaction fees charged to your Stateside bank card and you're already north of $8.00/gallon.
Back to the cambio, what? "Grazie signore."
We'll wrap it here with the Gold Stack:
Gold’s All-Time High: 1923 (06 September 2011)
The Gateway to 2000: 1900+
The Final Frontier: 1800-1900
The Northern Front: 1750-1800
The Floor: 1579-1466
The 300-day Moving Average: 1528
Le Sous-sol: Sub-1466
Notable Structural Resistance: 1463 / 1472-1479 / 1524-1535
The Weekly Parabolic Price to flip Long: 1420
Base Camp: 1377
Trading Resistance: (none)
Gold Currently: 1352, (weighted-average trading range per day: 26 points)
Trading Support: 1347 / 1343 / 1333 / 1317 / 1281 / 1271
10-Session “volume-weighted” average price magnet: 1308, (directional range: 1251 up to 1356 = 105 points or +8%)
Structural Support: 1266 / 1227
We'll get more catching up on tardy economic data in the new week, and in the midst of it all on Wednesday, we've the Federal Open Market Committee's next policy decision on rates. Scary enough already, given Thursday's then being Halloween, (which when I was a kid was a two-to-three hour evening jaunt through the neighbourhood that today has become an eight-to-nine week marathon, running from Labor Day through October, of purchasing plastic phantoms et alia and placing them all over one's lawn. Perhaps we ought add Halloween paraphernalia purchasing into our Economic Barometer).
- English (UK)
- English (India)
- English (Canada)
- English (Australia)
- English (South Africa)
- English (Philippines)
- English (Nigeria)
- Deutsch
- Español (España)
- Español (México)
- Français
- Italiano
- Nederlands
- Português (Portugal)
- Polski
- Português (Brasil)
- Русский
- Türkçe
- العربية
- Ελληνικά
- Svenska
- Suomi
- עברית
- 日本語
- 한국어
- 简体中文
- 繁體中文
- Bahasa Indonesia
- Bahasa Melayu
- ไทย
- Tiếng Việt
- हिंदी
Gold: What Are We Doing Down Here?
Published 10/28/2013, 02:29 AM
Updated 07/09/2023, 06:31 AM
Gold: What Are We Doing Down Here?
3rd party Ad. Not an offer or recommendation by Investing.com. See disclosure here or
remove ads
.
Latest comments
Install Our App
Risk Disclosure: Trading in financial instruments and/or cryptocurrencies involves high risks including the risk of losing some, or all, of your investment amount, and may not be suitable for all investors. Prices of cryptocurrencies are extremely volatile and may be affected by external factors such as financial, regulatory or political events. Trading on margin increases the financial risks.
Before deciding to trade in financial instrument or cryptocurrencies you should be fully informed of the risks and costs associated with trading the financial markets, carefully consider your investment objectives, level of experience, and risk appetite, and seek professional advice where needed.
Fusion Media would like to remind you that the data contained in this website is not necessarily real-time nor accurate. The data and prices on the website are not necessarily provided by any market or exchange, but may be provided by market makers, and so prices may not be accurate and may differ from the actual price at any given market, meaning prices are indicative and not appropriate for trading purposes. Fusion Media and any provider of the data contained in this website will not accept liability for any loss or damage as a result of your trading, or your reliance on the information contained within this website.
It is prohibited to use, store, reproduce, display, modify, transmit or distribute the data contained in this website without the explicit prior written permission of Fusion Media and/or the data provider. All intellectual property rights are reserved by the providers and/or the exchange providing the data contained in this website.
Fusion Media may be compensated by the advertisers that appear on the website, based on your interaction with the advertisements or advertisers.
© 2007-2024 - Fusion Media Limited. All Rights Reserved.