As the saying goes; “History often repeats, but is never exactly the same.” The same can be said for asset classes, if one understands their long term cycles. Let’s examine Gold.
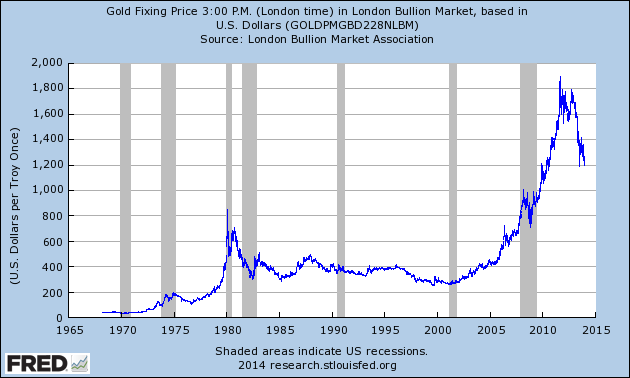
From 1970-1980 Gold entered its first real bull market, in USD terms, rising from $35 to $873. It then entered a 21 year bear market bottoming at $256 in 2001. Both the bull and bear markets left behind certain characteristics. From 2001-2011 Gold had its second bull market, rising from $256 to $1924. In percentage terms it was not as great as the first. But in USD terms it was nearly twice as large.
After analyzing the 21 year bear market, 1980-2001, in OEW terms. We determined its bear market pattern. It was basically a double three, abc-x-abc, with the second abc taking up most of the time. The first abc was only five years in duration: 1980-1985. Notice, however, the two best bear market rallies were the first B wave and the X wave. They both retraced about 38.2% of the associated previous decline.
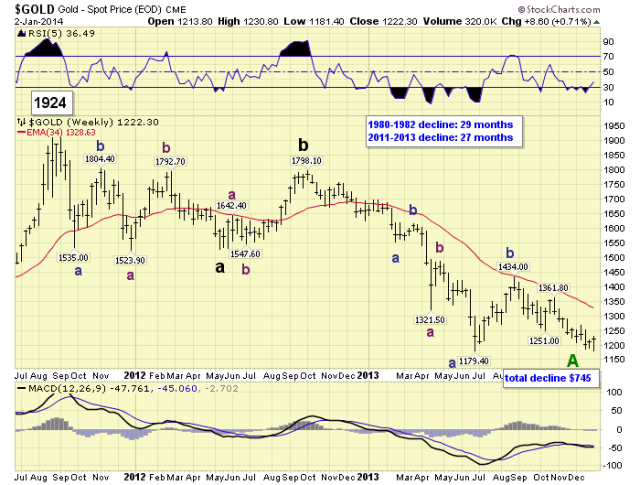
Normally we do not attempt to trade in bear markets. They sometimes can become like bottomless pits. Many of the Gold bulls are probably feeling that way now. However, we did find something quite striking when reviewing the first A wave of the previous bear market: 1980-1982; and the current A wave of this bear market: 2011-2013.
During 1980-1982, Primary A took 29 months, and declined in basically three Major waves: $463-$749-$298. Currently, Primary A has taken 27 months, and has declined in basically three Major waves: $1524-$1798-$1179 thus far. On the surface it does not appear to be much, except the time factor is quite similar. But let’s put the declines side by side.
- 1980-1982: Major A $410, Major B $285 and Major C $450, for a total decline of $575.
- 2011-2013: Major A $400, Major B $270 and Major C $670, for a total decline of $750.

Notice both Primary A waves are quite similar, in time and price. Our Primary A wave count suggests Gold may have recently bottomed in December. We have a completed Major A @ $1524, a completed Major B @ $1798, and potentially a completed Major C @ $1181 at the December low. Should this be correct we could now witness a 38.2% retracement of the entire first decline, ($1924-$1179), into the $1460 area over the next 3-8 months. This would represent a $280 rise. Which is also similar to the $220+ rises of Primary B and Primary X during the last bear market. “History often repeats, but is never exactly the same.”