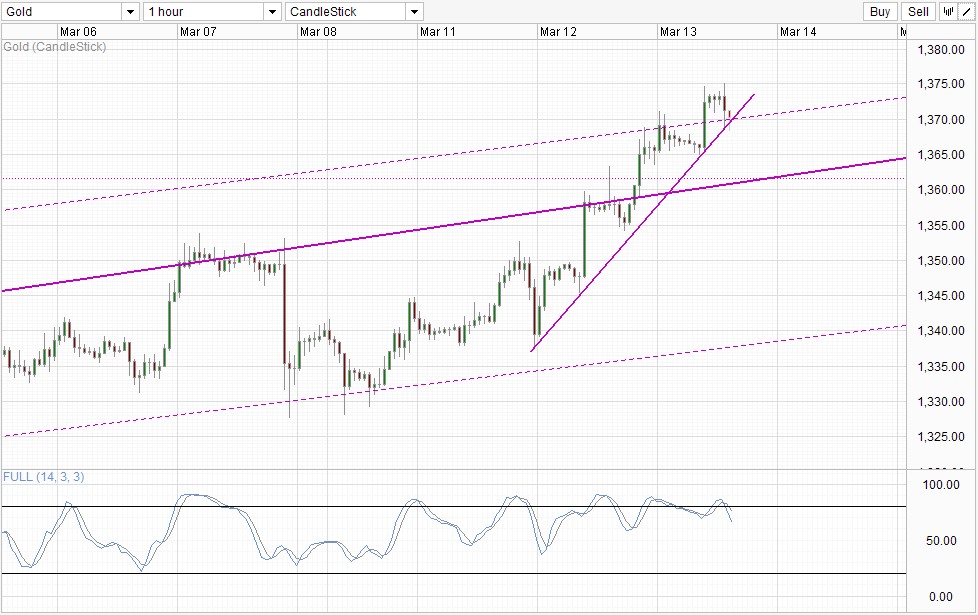
The gold bug is alive and well. Prices climbed once more during the US session yesterday, sending price all the way up to 1,371 before coming back down. Once again the increase in prices is inexplicable as risk appetite during US session wasn't exactly the most bearish. S&P 500 gapped lower on open but climbed steadily higher for the rest of the session to close at +0.03%. Dow Jones Industrial Average had similar fortune but failed to cross the line in the sand to close at -0.07%. Hence, it is clearly not fear that is pushing safe haven Gold up higher, suggesting that this bull run is just continuing running on sentiment alone.
Hourly Chart
That is not inherently a bad thing, as the potential for even stronger gains moving forward is there should broad risk appetite start to turn bearish again. Unfortunately, Asian markets were less than helpful to this end, with Australia's ASX and Nikkei 225, and Hang Seng Index firmly in the black this morning. Nonetheless, Gold prices continued to climb sharply higher when the majority of Asia stock exchanges were opened, sending price to a fresh 6 month high.
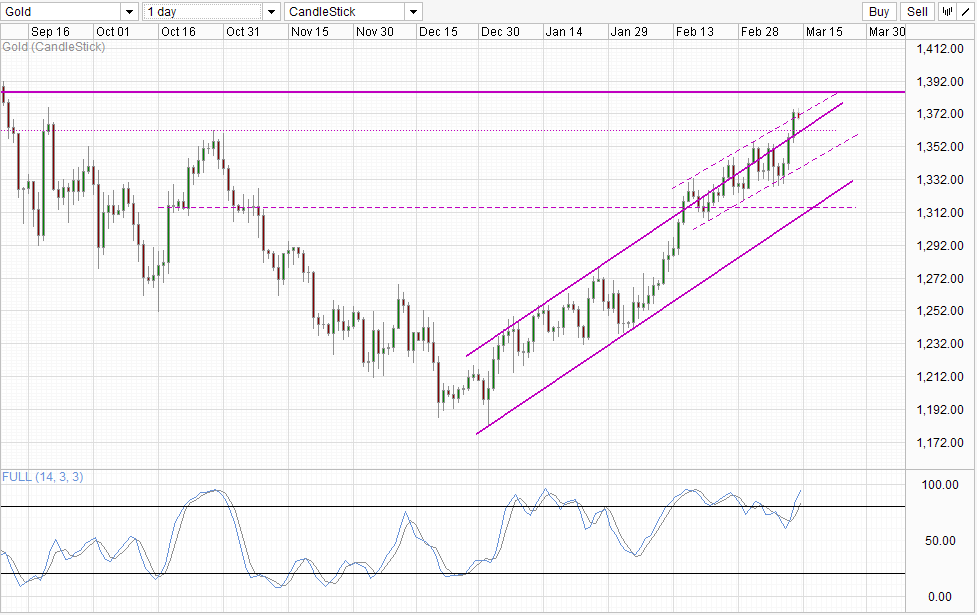
Prices have since climbed down a little bit, staying above the intersection between the rising trendline and Channel Top seen on Daily Chart below. This decline is not unexpected as the rallies in the past 24 hours and in fact the entire week has been less than fully justified. Furthermore, Stochastic readings have been favoring a bearish cycle scenario, implying that some form of bearish pullback should be expected. Nonetheless, it is unlikely that the aforementioned support intersection will be broken as risk appetite appears to be bearish once again. Nikkei 225 closed 0.10% lower D/D after shedding all the earlier gains and then some during the final hour of trade, while Hang Seng Index is now trading -0.41%, a trend that is reflected in most major Asian stock indexes that are still trading at the time of writing. This risk off appetite will keep prices afloat for now especially if such sentiment spillover to Europe and US session later, which will help price to stay above 1,371 in the short-term.
Daily Chart
Bullish prospect for Gold continue to remain weak though despite all the significant strides bulls have made this week. Despite breaking above the swing high seen on Oct 2013, price will now face additional resistance around 1,380, and eventually 1,390 and 1,400. Given that fundamentals ex Ukraine/Russia crisis for Gold do not support long-term rallies, the likelihood of bullish sentiment failing at any aforementioned resistance levels is high. But that is the issue of a bullish rally following a year-long bearish sell-off - resistances levels are easily found and bulls will need to put in extra shift in order to demonstrate strong conviction that this rally is sustainable and not merely a correction.


