Most gold analysts think that gold is in a bull market, or a bear market. They use charts and US economic reports to try to prove that the gold price price is ready to move substantially higher or lower.
In contrast, I’ve argued that the world gold market is in a state of transition. It’s transitioning from a Western fear trade orientation, to an Eastern love trade orientation, and thus gold is on the cusp of a “bull era”.
The last century was dominated by the America. During America’s “heyday”, companies like Xerox (NYSE:XRX) and General Motors (NYSE:GM) staged relentless increases in quarterly earnings, and this was consistently followed by massive increases in their stock prices.
That’s because institutional money managers base their liquidity flows on earnings reports. They don’t care if a chart looks bullish or bearish.
They care about earnings growth and cash flow growth.
Even more importantly, mainstream money managers look for consistency of earnings growth, and consistency of cash flow growth.
Price drivers like QE, Greece, and OTC derivatives don’t create cash flow and earnings growth consistency for gold stocks. They create volatility, and that’s not something that an institutional money manager likes to see.
I don’t think most investors realize what kind of sea change is taking place in the gold stocks sector right now. It’s a process that can turn gold stocks into one of the most stable cash flow cows… in the history of investing.
In China and India, good economic news is a reason to buy gold, and bad economic news is also a reason to buy gold. The steady rise in demand created by industrialization in these countries, coupled with static mine supply, is poised to turn the gold stocks sector into an institutional darling.

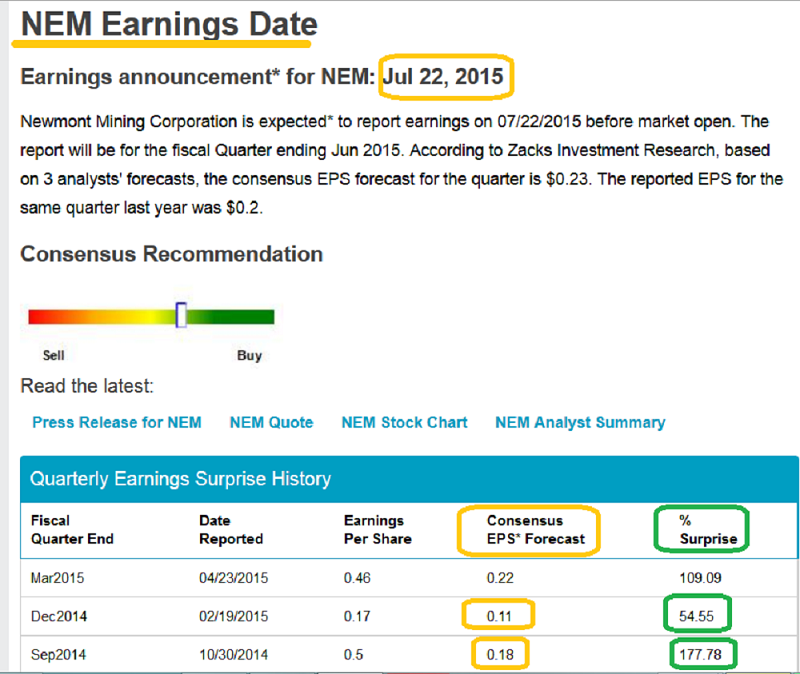
That’s a snapshot of recent quarterly earnings for Newmont Mining Corporation (NYSE:NEM).
Once a company starts to show sizable increases in quarterly earnings and cash flow, institutional money managers of size begin to pay serious attention to that company.
Newmont is a gold stock sector leader, and it’s staged some phenomenal and consistent growth in quarterly earnings. That has stunned institutional money managers, and brought them to the investment table.
The next Newmont earnings report is scheduled for July 22. If there’s another upside surprise, institutional money is going to pour into Newmont, and the stock should begin a new leg to the upside.

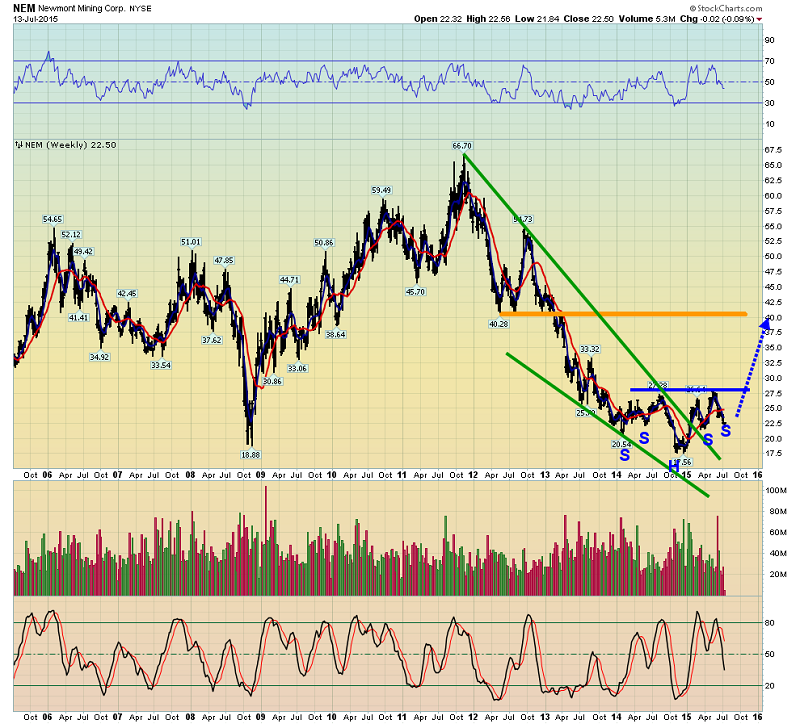
That’s another look at Newmont, using the weekly chart. Chindian demand can realistically add about $100 - $200 to the gold price floor, over the next 18 months. It can do it in a very stable manner.
To most amateur investors living in the legacy of fear trade era, that might not seem like much of a price spike. To an institutional money manager following earnings reports from companies like Newmont Mining Corporation (NYSE:NEM), Barrick Gold Corporation (NYSE:ABX), Agnico Eagle Mines Limited (NYSE:AEM) and Goldcorp Inc. (NYSE:GG), it turns those companies into consistent cash cows.
Gold stock charts can’t be used in isolation from earnings reports. The reason that most investors were so negative about gold stocks at the end of 2014 was because they were focused on things like QE and rate hikes, rather than corporate earnings.
That’s why they missed the boat with Newmont, and it’s why they may miss the entire gold stocks sector boat, as it sails up the chart, in 2016!
Newmont is probably going to move steadily toward the $40 area in 2016. Investors who waste time waiting for some magical “chart breakout” will never make any serious money in the market, and certainly not with a key stock like Newmont.

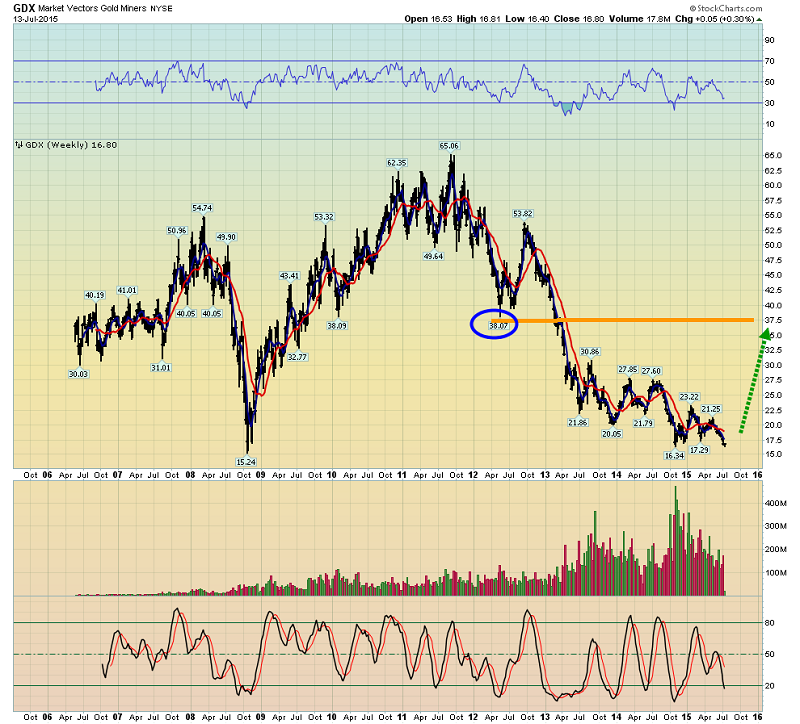
As Newmont moves toward $40, I expect Market Vectors Gold Miners (ARCA:GDX) will rise toward $38. That’s the weekly chart for GDX.
No chart formation is going to move GDX higher or lower. It’s institutional liquidity flows that matter, and as mining costs stabilize, and Chindian demand is already quantified by top bank economists as steadily rising, good earnings reports will make the entire Western gold community happy, and GDX will move toward $38!
When the fear trade dominated gold price discovery, it was very difficult for money managers to make long term projections about the gold price. That’s changed with the rise of the love trade, and the rise in oil supply.
As Iran is welcomed back into the international community, even more oil supply will make its way onto the market. Also, China may have large reserves of oil and gas that can be tapped by the use of fracking. Fuel prices for gold mining are becoming incredibly stable, and the love trade is creating stable and consistently growing demand.

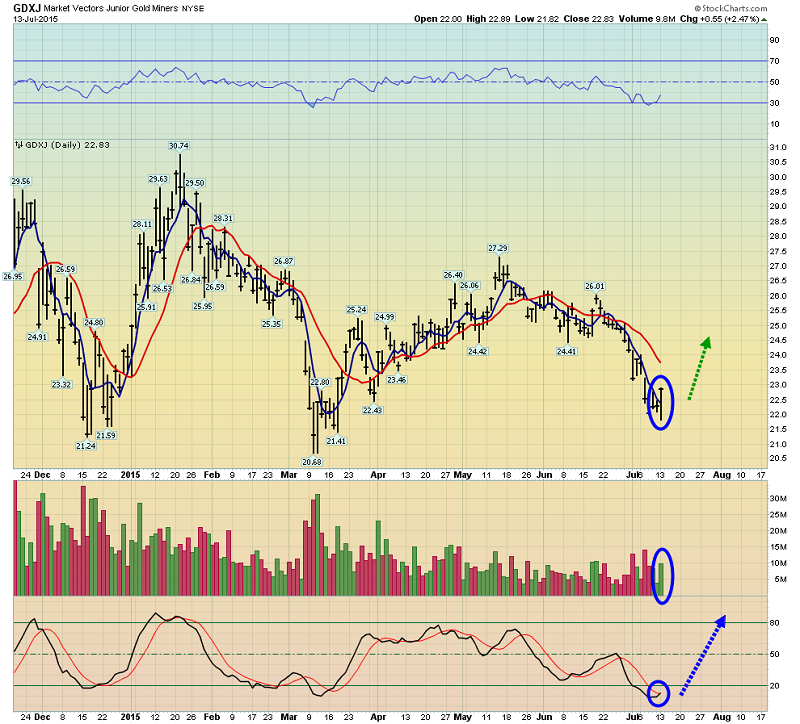
The bottom line is that here’s never been a better time in history to confidently invest in gold stocks, than right now! That’s the daily chart for Market Vectors Junior Gold Miners (ARCA:GDXJ). Junior and intermediate gold stocks that have decent AISC (all-in sustaining costs) can do extremely well in the bull era.
Yesterday’s price, volume, and oscillator action was impressive. Note the beautiful position of the 14,7,7 Stochastics oscillator, at the bottom of the chart. The traditional summer rally for gold stocks may now be in play!
