Recently, the Erste Group published a 120 page report covering precious metals. The report contains an absolute treasure of analysis, figures and charts concerning gold and the gold stocks. I have selected a few of the charts which help us explain the current status of gold stocks.
Essentially, there is a huge divergence between financial performance and valuations. Ultimately, the performance of the shares over the coming months will answer the question as to the resolution of that divergence.
We often hear how difficult of a time some mining companies are having. Although that is true, the reality is, present conditions for gold miners have never been better. Rising costs are a problem but margins for the large unhedged producers are at bull market highs (and likely all-time highs).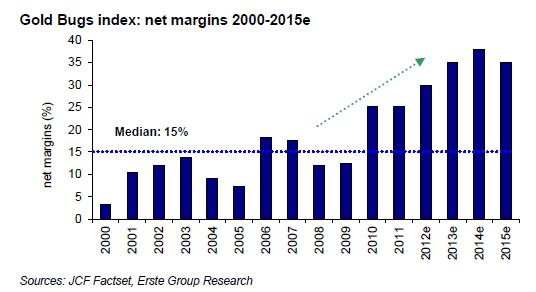
The rising margins explain the consistent increase in cash flow and net income (with a few bumps) as the chart below depicts. Cash flow and net income for 2012 will also reach a bull market high.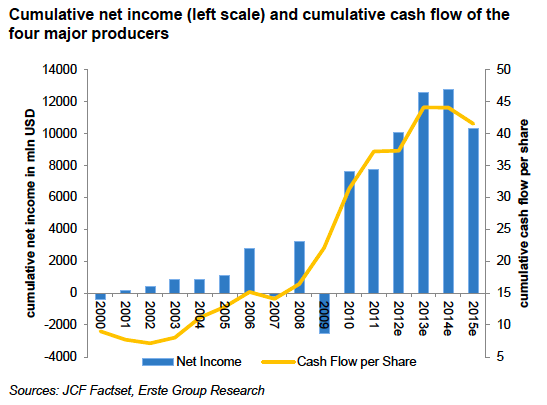
Given the high margins, cash flow growth and record earnings, why are the stocks struggling and trading well off their highs? A major and often forgotten explanation is the current low valuations. Several months ago, the price to cash flow valuation of senior producers was equivalent to valuation lows seen in 2000 and 2008. No chart better illustrates valuations then this one from BMO Capital Markets.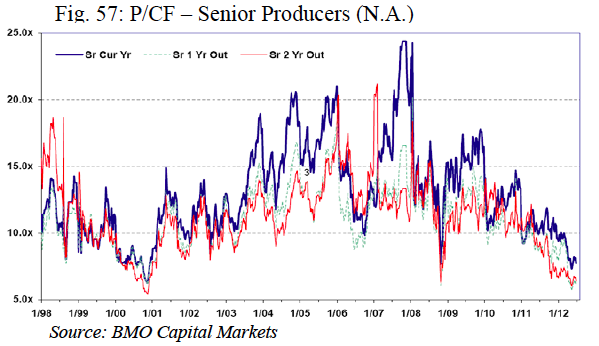
Now let’s examine the current technicals and draw a comparison between today’s bull market and the bull market from 1960 to 1980. Below we plot the current bull market in the HUI (red) and the Barron’s Gold Mining Index (BGMI). There are some differences but also some similarities. Note that the level 170 was key support and resistance for the BGMI for nearly five years. Once the BGMI broke 170, it was headed much higher.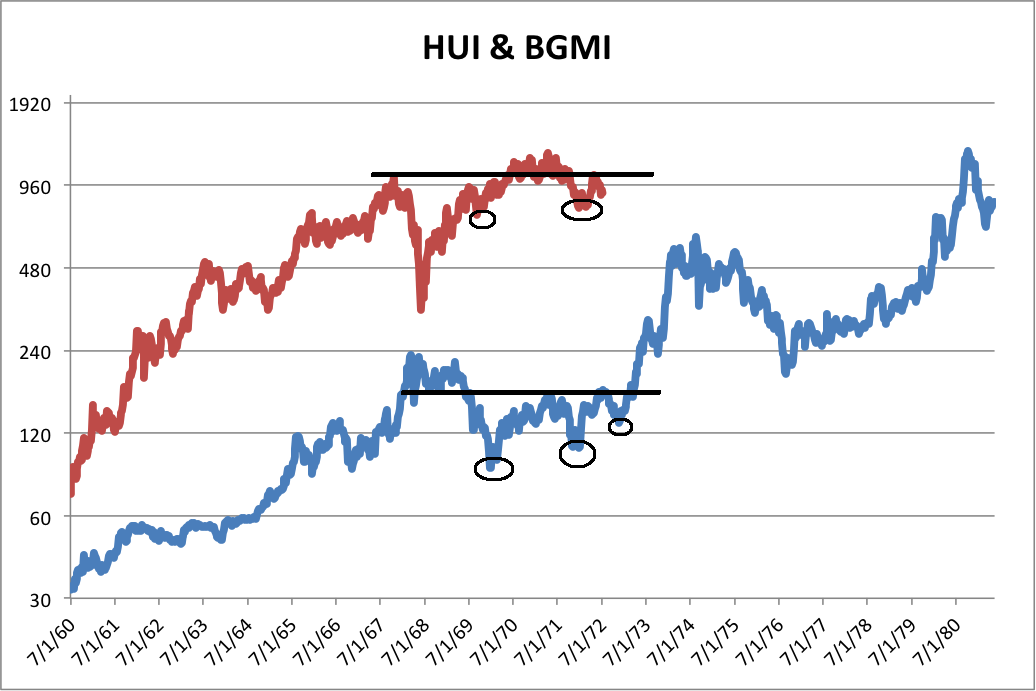
One can better view the current key pivot point from the chart below. The 52-55 range has been key support and resistance for GDX since late 2007. If and when GDX makes a weekly close above 55, you can bet that the prognosis will look quite bullish.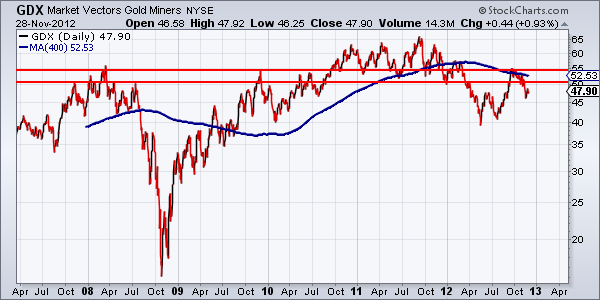
The market is at an interesting crossroads. Financial results have been strong but valuations are weak. The market believes earnings and cash flow will decline and has priced in that outcome to some degree.
Ultimately, this will resolve itself in one of two ways. Producer margins can decline which would impact cash flows and profitability. That would eventually lead to lower share prices and the Gold Miners ETF (GDX) could threaten a break below 40.
On the other hand, should margins increase then share prices will explode higher from a compounding effect. Rising margins will generate stronger cash flow and higher profits and the low valuations will rebound as sentiment would normalize. This is the fundamental case for the next major breakout in the gold shares.
Given the technical damage from the recent selloff (which went a bit further than expected) one should not anticipate this crossroads to be resolved anytime soon. Think months rather than days or weeks.
Ultimately, the shares will break 55 to the upside in 2013 thanks to the combination of a breakout in Gold combined with stable costs in 2013. In the meantime the shares will consolidate providing you time to do your research and find the companies that will lead the next leg higher and outperform.
- English (UK)
- English (India)
- English (Canada)
- English (Australia)
- English (South Africa)
- English (Philippines)
- English (Nigeria)
- Deutsch
- Español (España)
- Español (México)
- Français
- Italiano
- Nederlands
- Português (Portugal)
- Polski
- Português (Brasil)
- Русский
- Türkçe
- العربية
- Ελληνικά
- Svenska
- Suomi
- עברית
- 日本語
- 한국어
- 简体中文
- 繁體中文
- Bahasa Indonesia
- Bahasa Melayu
- ไทย
- Tiếng Việt
- हिंदी
Gold Stocks Approaching A Crossroads
Published 11/29/2012, 05:56 AM
Updated 07/09/2023, 06:31 AM
Gold Stocks Approaching A Crossroads
3rd party Ad. Not an offer or recommendation by Investing.com. See disclosure here or
remove ads
.
Latest comments
I think the current sell-off in the miners reflects the market's fear of a repeat of 2008. In 2008, the mining stocks were annihilated but bottomed 6 months ahead of the SPX. I think we've already seen the "2008 fear factor
" priced into the market. Unless gold/silver take huge dive from here, the risk of missing a big upside move outweighs the risk of getting clobbered.
Install Our App
Risk Disclosure: Trading in financial instruments and/or cryptocurrencies involves high risks including the risk of losing some, or all, of your investment amount, and may not be suitable for all investors. Prices of cryptocurrencies are extremely volatile and may be affected by external factors such as financial, regulatory or political events. Trading on margin increases the financial risks.
Before deciding to trade in financial instrument or cryptocurrencies you should be fully informed of the risks and costs associated with trading the financial markets, carefully consider your investment objectives, level of experience, and risk appetite, and seek professional advice where needed.
Fusion Media would like to remind you that the data contained in this website is not necessarily real-time nor accurate. The data and prices on the website are not necessarily provided by any market or exchange, but may be provided by market makers, and so prices may not be accurate and may differ from the actual price at any given market, meaning prices are indicative and not appropriate for trading purposes. Fusion Media and any provider of the data contained in this website will not accept liability for any loss or damage as a result of your trading, or your reliance on the information contained within this website.
It is prohibited to use, store, reproduce, display, modify, transmit or distribute the data contained in this website without the explicit prior written permission of Fusion Media and/or the data provider. All intellectual property rights are reserved by the providers and/or the exchange providing the data contained in this website.
Fusion Media may be compensated by the advertisers that appear on the website, based on your interaction with the advertisements or advertisers.
© 2007-2024 - Fusion Media Limited. All Rights Reserved.
