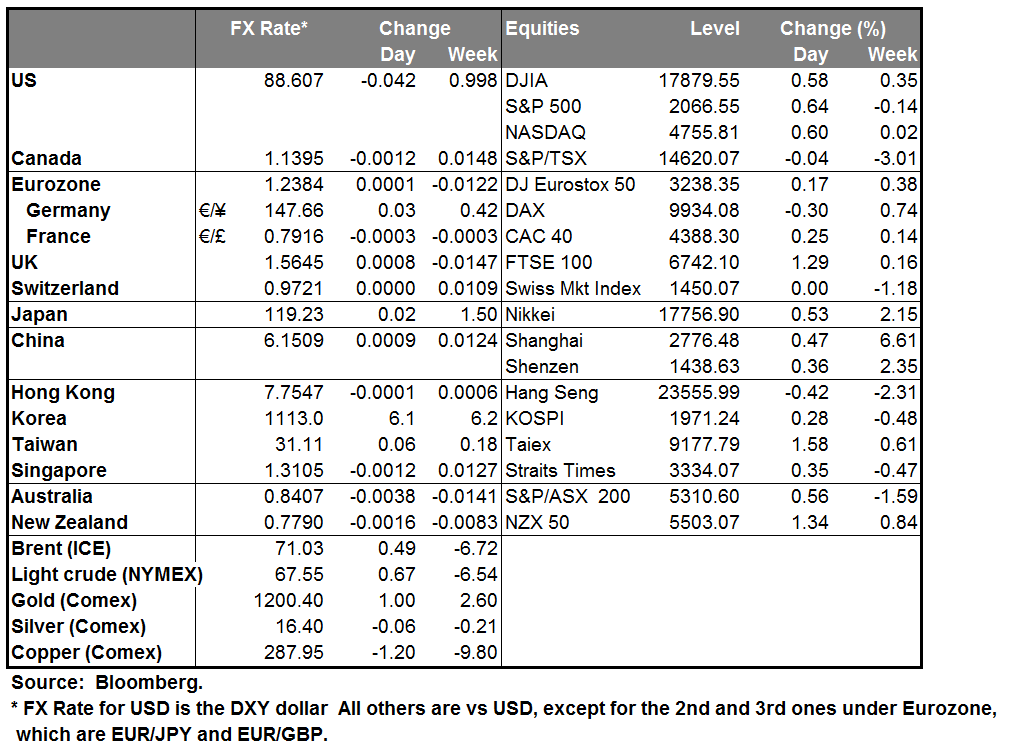
Bank of Canada to remain on hold the BoC is expected to sit tight at today’s meeting, keeping its benchmark interest rate unchanged in its final decision of 2014. Even though Canadian inflation is rising and the recent batch of data suggest that the economy has strong momentum, declining oil prices are likely to keep BoC on hold for longer than it would otherwise, leaving CAD vulnerable. On the other hand, since they won’t be providing new forecasts, a less dovish statement than previously could benefit CAD at least temporarily, not so against USD, but more vs its crosses like EUR and JPY.
The Australian dollar plunged to a 4 year low against the dollar after the country’s GDP grew 0.3% qoq in Q3, from 0.5% qoq in Q2, missing expectations of a 0.7% qoq rise. This left the year-on-year growth rate unchanged at 2.7%, from a downwardly revised prior figure and below consensus of a 3.1% rate. The fall in the growth rate underscores concerns about Australia’s outlook and is in contrast with the RBA statement on Tuesday that the most recent data are consistent with moderate economic growth. AUD/USD dipped briefly below 0.8400 at the release but bounced back to trade few pips above that level. A lower exchange rate is needed for Australia to achieve balanced growth and the ongoing decline of key commodities are likely to keep the AUD under selling pressure.
Elsewhere, NZD was the second worst performer against the dollar after whole milk powder price (the country’s main export product) fell 7.1% at the latest auction. The pair fell approximately 0.80% but bounced up after finding support a touch below the 0.7770 level. Given the negative sentiment towards NZD, we could see a test again of that level in the near future.
Overnight, China’s non-manufacturing PMI and HSBC service-sector PMI, both for November, increased a bit with limited impact on AUD and NZD.
As for today’s activity, we get the final service-sector PMIs for November from the countries we got the manufacturing data for on Monday. As usual, the final forecasts from France, Germany and Eurozone are the same as the initial estimates, while the UK service-sector PMI is expected to have increased slightly. The revisions in the final manufacturing PMIs on Monday, increase the possibilities that we could see revisions in the service-sector PMIs as well. Eurozone’s retail sales for October are also coming out and they are expected to have rebounded on a monthly basis. After the recent poor data, the forecast of a rebound will probably not be enough to reverse the negative sentiment towards EUR.
In the US, the most important indicator we get is the ADP employment report for November two days ahead of the NFP release. The ADP report is expected to show that the private sector gained fewer jobs in November than it did the previous month. The final Markit service-sector PMI and the ISM non-manufacturing index, both for November, are also to be released. Fed’s Beige book, a survey based on reports from the 12 regional banks of the Federal Reserve System, is also due out, in order to give the FOMC anecdotal information about the economy before its Dec. 16-17 policy meeting
As for the speakers, Philadelphia Fed President Charles Plosser and Fed Governor Lael Brainard speak.
The Market
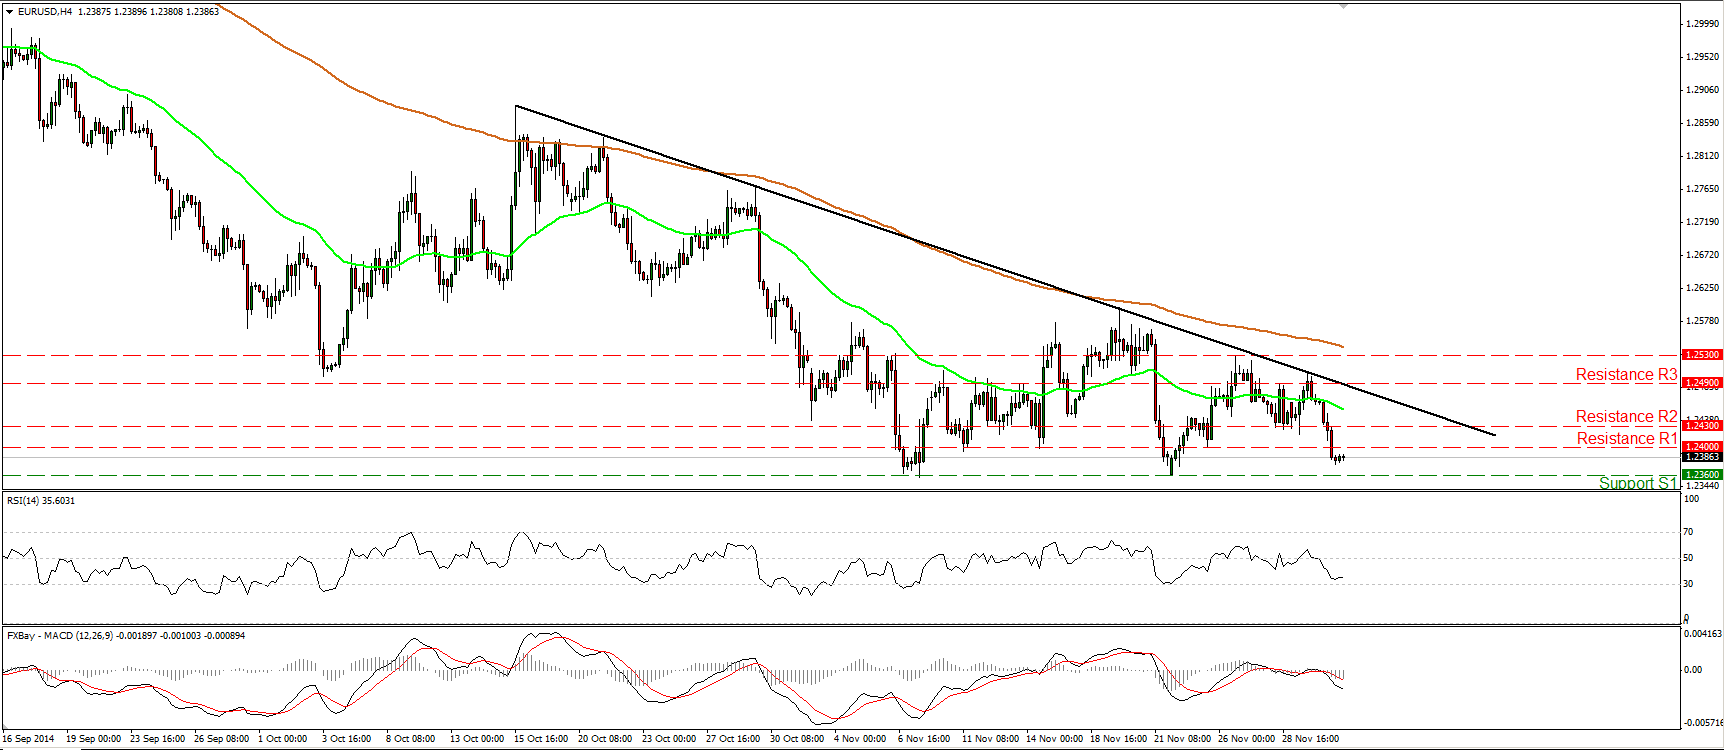
EUR/USD tumbles once again below 1.2400
EUR/USD declined on Tuesday after finding resistance at the black near-term downtrend line taken from back at the high of the 15th of October. The rate slid once again below the 1.2400 (R1) line and is now trading between that hurdle and the key support of 1.2360 (S1), defined by the lows of the 7th and 24th of November. As long as the rate is trading below the aforementioned downtrend line, I would stick to the view that the near-term outlook stays negative. A clear close below the 1.2360 (S1) barrier would confirm a forthcoming lower low on the daily chart and perhaps signal the continuation of the longer-term downtrend. Such a break is likely to pave the way for the 1.2250 (S2) area, defined by the lows of August 2012.
• Support: 1.2360 (S1), 1.2250 (S2), 1.2130 (S3)
• Resistance: 1.2400 (R1), 1.2430 (R2), 1.2490 (R3)
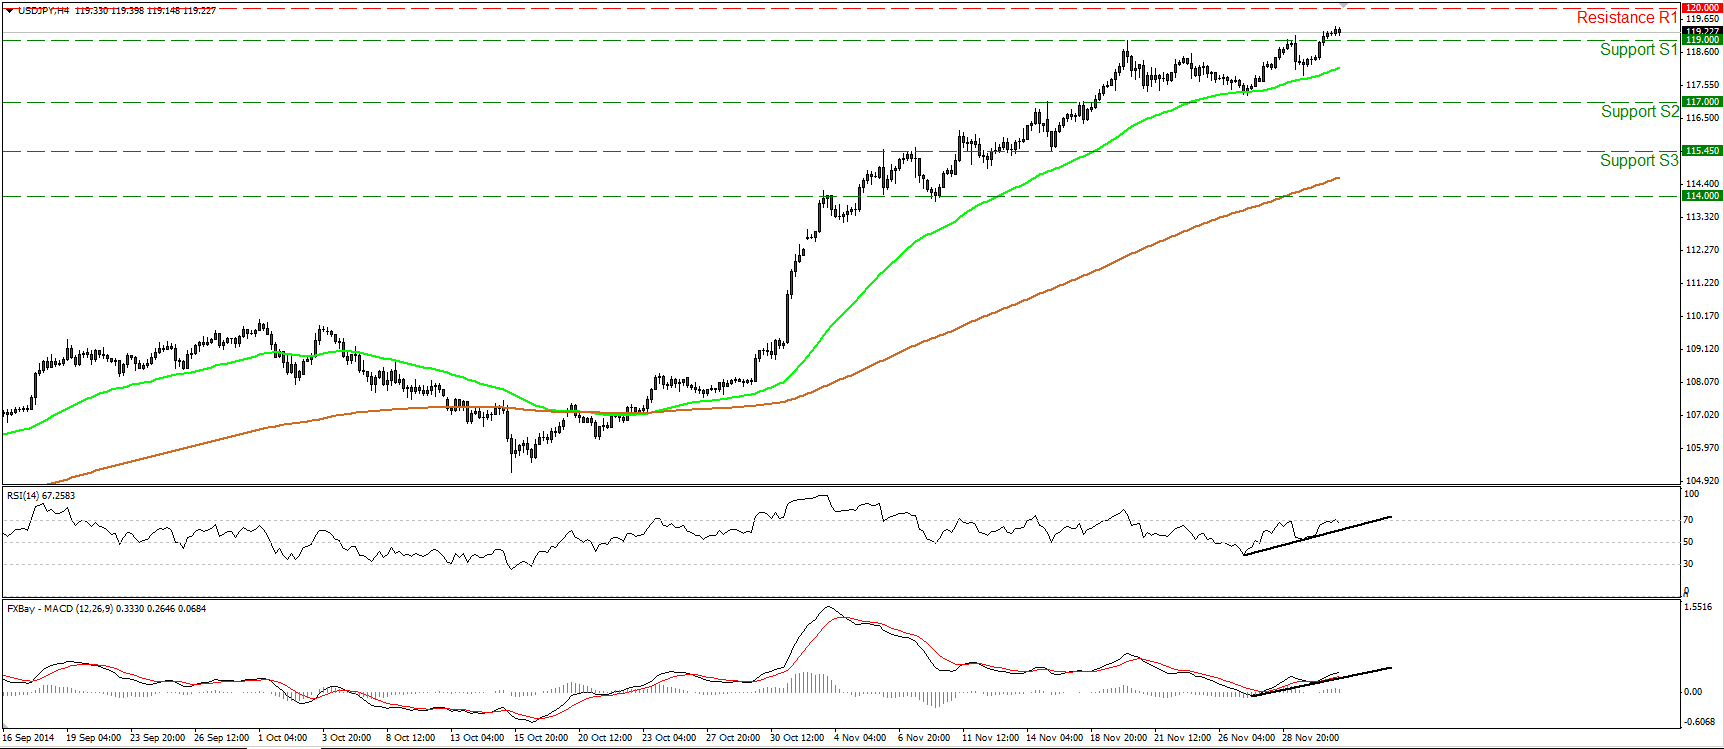
USD/JPY breaks above 119.00
USD/JPY edged higher yesterday breaking above the resistance (turned into support) hurdle of 119.00 (S1). I would now expect the rate to challenge the critical line of 120.00 (R1), which happens to be the 61.8% retracement level of the 1998-2012 major downtrend. A clear violation of that key obstacle could have larger bullish implications and perhaps target the 122.50 (R2) resistance, marked by the high of the 20th of July 2007. On the daily chart, the price structure remains higher peaks and higher troughs above both the 50- and the 200-day moving averages. Thereafter I still consider the overall path of this pair to be to the upside.
• Support: 119.00 (S1), 117.00 (S2), 115.45 (S3)
• Resistance: 120.00 (R1), 122.50 (R2), 124.00 (R3)
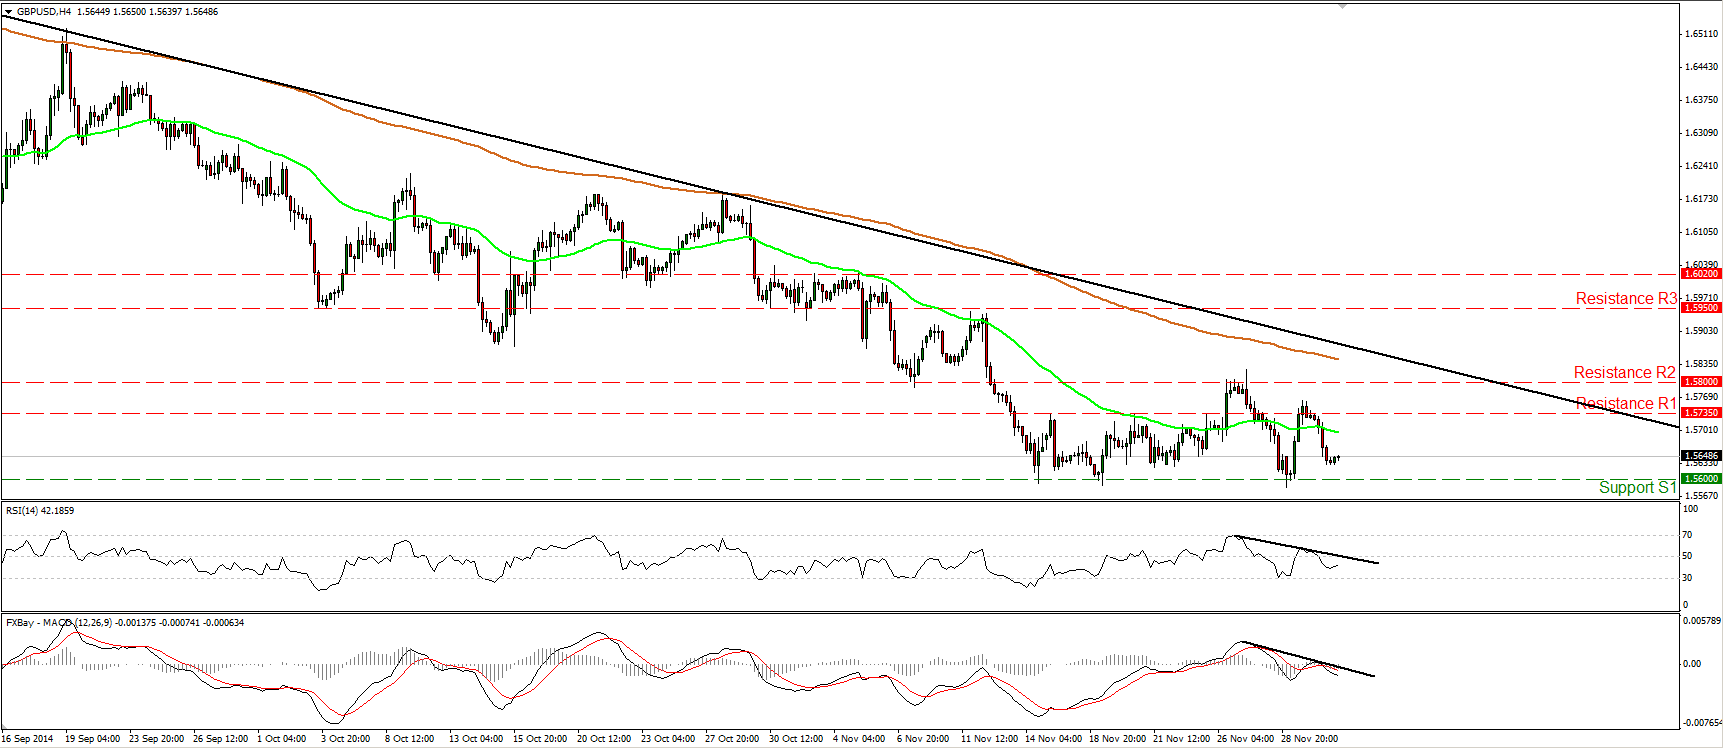
GBP/USD slightly above 1.5600
GBP/USD slid after finding resistance marginally above the 1.5735 (R1) resistance line but the decline was stopped slightly above the well-tested 1.5600 (S1) area. Shifting our attention to our short-term oscillators, I see that both of them stay in their bearish zones and below their respective downside resistance lines. Moreover, the MACD stands below its trigger line and is pointing south. This designates negative momentum and amplifies the case that we are likely to see Cable lower in the near future. As for the broader trend, the price structure remains lower peaks and lower troughs below the 80-day exponential moving average, thus I would consider the overall picture of GBP/USD to stay negative.
• Support: 1.5600 (S1), 1.5500 (S2), 1.5430 (S3)
• Resistance: 1.5735 (R1), 1.5800 (R2), 1.5950 (R3)
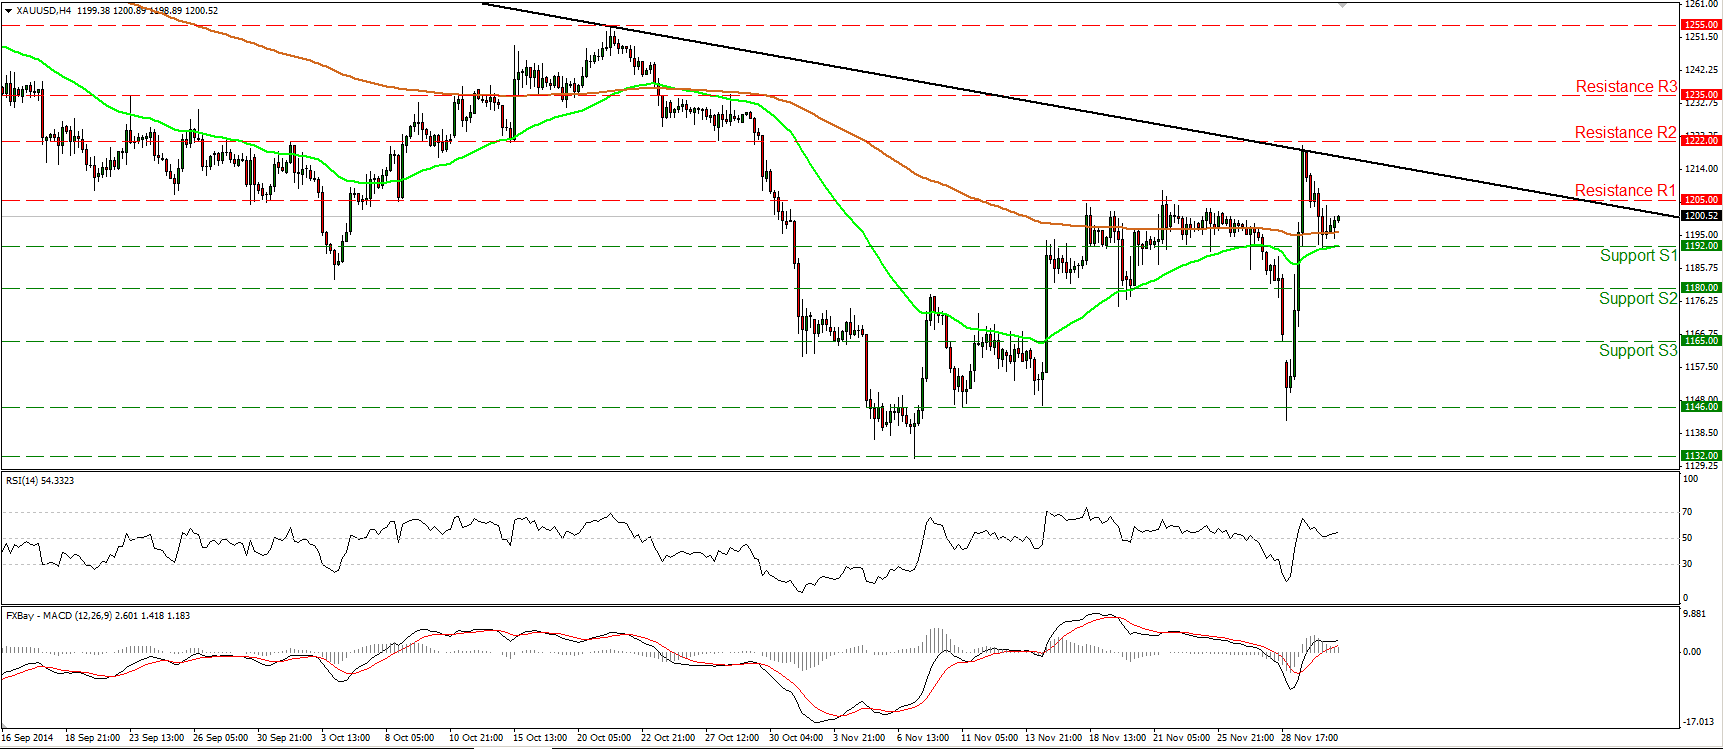
Gold slides below 1205
Gold continued pulling back on Tuesday, to fall below the 1205 (R1) barrier and to find support at 1192 (S1). With no clear trending conditions in the near term I would prefer to maintain my flat stance for now. On the daily chart, the yellow metal found resistance near the downtrend line taken from back the high of the 10th of July, and this keeps the longer-term downtrend intact. However, the 14-day RSI stands above its 50 line, while the daily MACD, already above its trigger, appears ready to challenge its zero line. These momentum signs give me extra reasons to sit on the sidelines, at least for now.
• Support: 1192 (S1), 1180 (S2), 1165 (S3)
• Resistance: 1205 (R1), 1222 (R2), 1235 (R3)
WTI somewhat lower
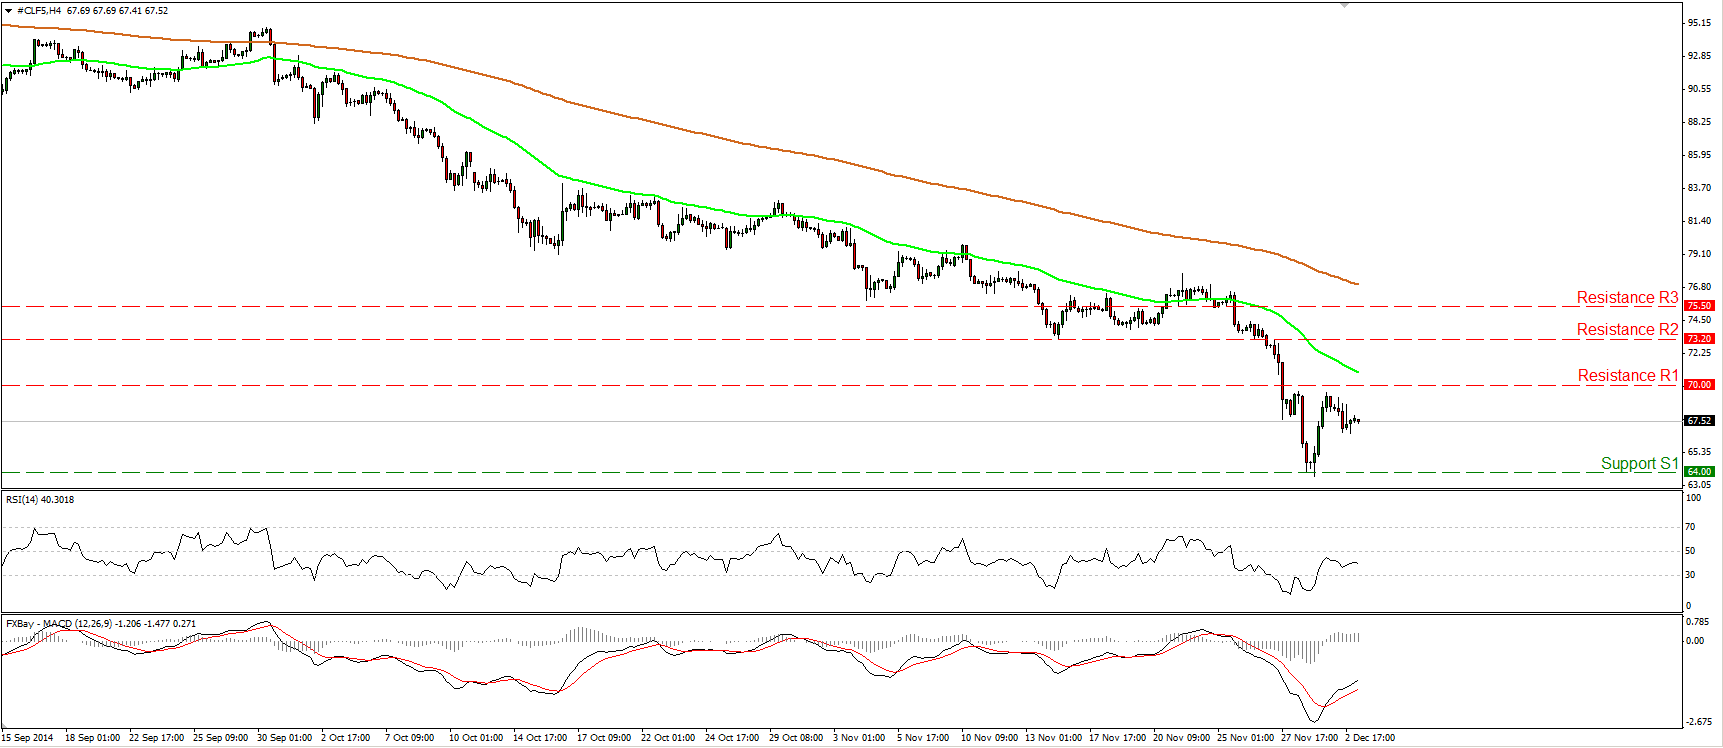
WTI seems to be resuming its downtrend, as it declined after finding resistance slightly below the psychological line of 70.00 (R1). If selling pressure continues, I would expect another test at the support line of 64.00 (S1), defined, by the lows of Monday. On the daily chart, the price structure remains lower peaks and lower troughs below both the 50- and the 200-day moving averages, which keeps the overall path of WTI to the downside. The daily oscillators maintain a negative tone as well. The 14-day RSI appears able to enter again its oversold field, while the daily MACD, already at extreme low levels, stands below its signal line and is pointing down.
• Support: 64.00 (S1), 62.70 (S2), 60.00 (S3)
• Resistance: 70.00 (R1), 73.20 (R2), 75.50 (R3)

