
The recent plunge in Gold has created a good trading opportunity in my opinion.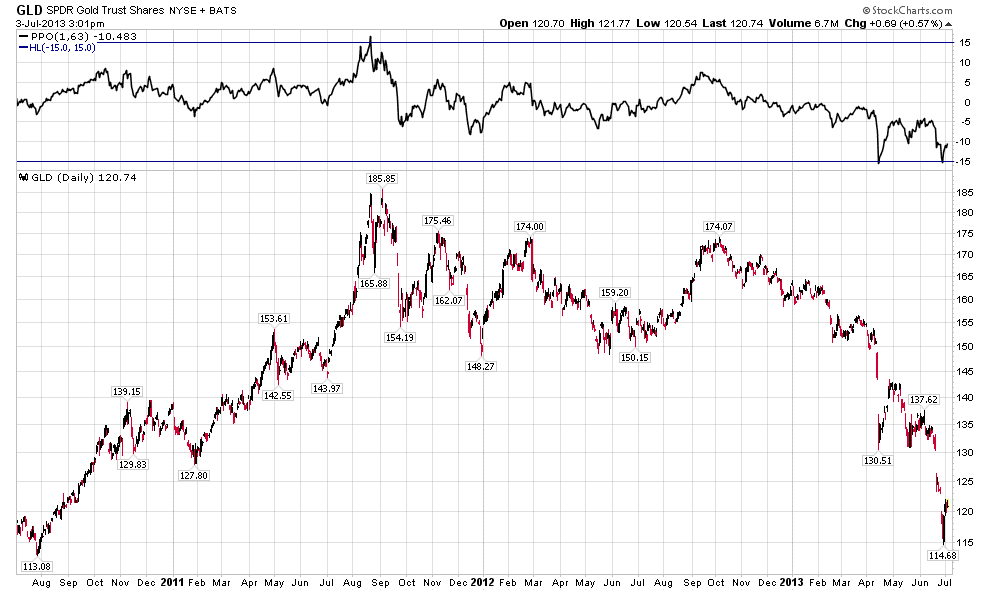
Here is the daily chart of SPDR Gold Trust Shares (GLD) covering the last 3 years. In the indicator window I placed PPO (1,63). The Percentage Price Oscillator (PPO) is a momentum oscillator that measures the difference between two EMA as a percentage of the larger moving average. On the GLD chart you can see PPO (1,63) which measures the difference between EMA (63) and EMA (1). I have EMA (63) on my charts computing the average price of a security over a quarter. You can see, that 15% mark in the indicator window represents an extreme in the PPO (1,63) readings over this period. On Jun 27 PPO (1,63) fell below 15% mark the second time over the last three months. Historically, it should lead to the mean reversion. It can be resolved by a sideways price action or a rebound. Taking into account the increasing volatility I am leaning toward the latter. 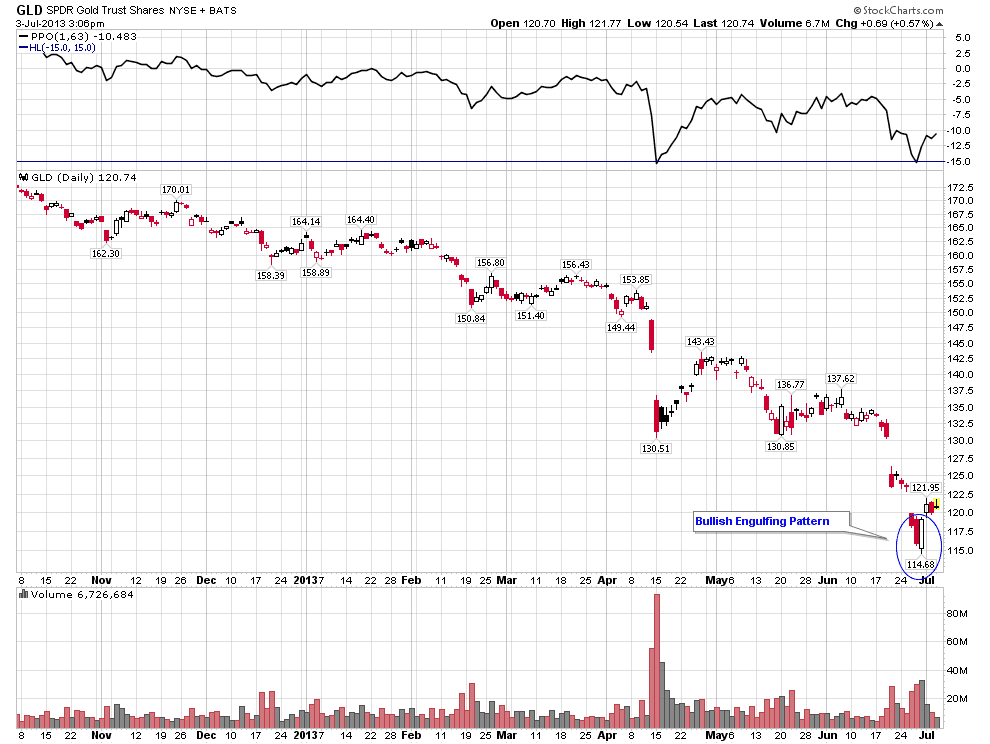
On the daily candlestick chart a Bullish Engulfing Pattern was formed on Jun 28 on high volume – a short-term reversal pattern.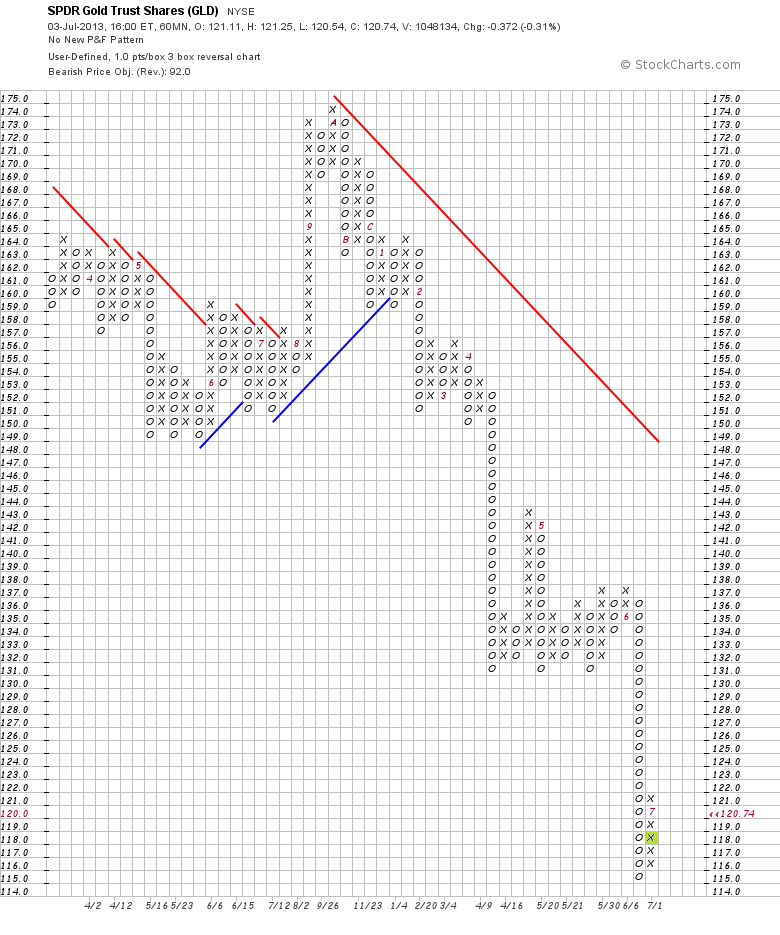
And now, last but not least, a Long Tail Down pattern was formed on my medium horizon P&F chart. A Long Tail Down is a column of Os with twenty Os at least. A 3 box upside reversal gives a buy signal.
Note that GLD is in the long-term downtrend. I consider a potential rebound only as a short-term trading opportunity.
I bought a calendar call spread today. If GLD stays below 125 to the end of this week, the sold weekly calls will expire worthless.
Bought to open GLD Aug13 125 call 10 contracts at $2.24
Sold to open GLD 05Jul13 125 Call 10 contracts at $0.09
Disclaimer: I express only my personal opinion on the market and do not provide any trading or financial advice (see Disclaimer on my site).
- English (UK)
- English (India)
- English (Canada)
- English (Australia)
- English (South Africa)
- English (Philippines)
- English (Nigeria)
- Deutsch
- Español (España)
- Español (México)
- Français
- Italiano
- Nederlands
- Português (Portugal)
- Polski
- Português (Brasil)
- Русский
- Türkçe
- العربية
- Ελληνικά
- Svenska
- Suomi
- עברית
- 日本語
- 한국어
- 简体中文
- 繁體中文
- Bahasa Indonesia
- Bahasa Melayu
- ไทย
- Tiếng Việt
- हिंदी
Gold Rebound Will Likely Continue
Published 07/04/2013, 03:07 AM
Updated 07/09/2023, 06:31 AM
Gold Rebound Will Likely Continue
3rd party Ad. Not an offer or recommendation by Investing.com. See disclosure here or
remove ads
.
Latest comments
Install Our App
Risk Disclosure: Trading in financial instruments and/or cryptocurrencies involves high risks including the risk of losing some, or all, of your investment amount, and may not be suitable for all investors. Prices of cryptocurrencies are extremely volatile and may be affected by external factors such as financial, regulatory or political events. Trading on margin increases the financial risks.
Before deciding to trade in financial instrument or cryptocurrencies you should be fully informed of the risks and costs associated with trading the financial markets, carefully consider your investment objectives, level of experience, and risk appetite, and seek professional advice where needed.
Fusion Media would like to remind you that the data contained in this website is not necessarily real-time nor accurate. The data and prices on the website are not necessarily provided by any market or exchange, but may be provided by market makers, and so prices may not be accurate and may differ from the actual price at any given market, meaning prices are indicative and not appropriate for trading purposes. Fusion Media and any provider of the data contained in this website will not accept liability for any loss or damage as a result of your trading, or your reliance on the information contained within this website.
It is prohibited to use, store, reproduce, display, modify, transmit or distribute the data contained in this website without the explicit prior written permission of Fusion Media and/or the data provider. All intellectual property rights are reserved by the providers and/or the exchange providing the data contained in this website.
Fusion Media may be compensated by the advertisers that appear on the website, based on your interaction with the advertisements or advertisers.
© 2007-2024 - Fusion Media Limited. All Rights Reserved.