Gold recorded the biggest weekly gain since October 2011, thanks to Ben Bernanke’s speech on Wednesday following the release of FOMC Meeting Minutes, telling markets that QE3 will be here to stay for the “foreseeable future”. This propelled Gold higher, as USD weakened significantly following the news, allowing the yellow metal to push above the 1,200 USD per ounce level which happens to be the cost price for mining and refining gold currently.
Along with fundamental reasons which favor a slightly more expensive Gold, Hedge Funds were also seen buying more Gold last week after the news, suggesting that speculators are getting back in the game. The latest CFTC Commitment of Trader data shows speculators increasing their net-long position by 4.1% for Gold Futures and Options, affirming the reports about Hedge Funds. It is also important to note that the numbers released pertain to 9th July data, which is 1 day before Bernanke’s speech. Putting 2 and 2 together, it stands to reason to believe that current speculative long positions should be even higher.
Weekly Chart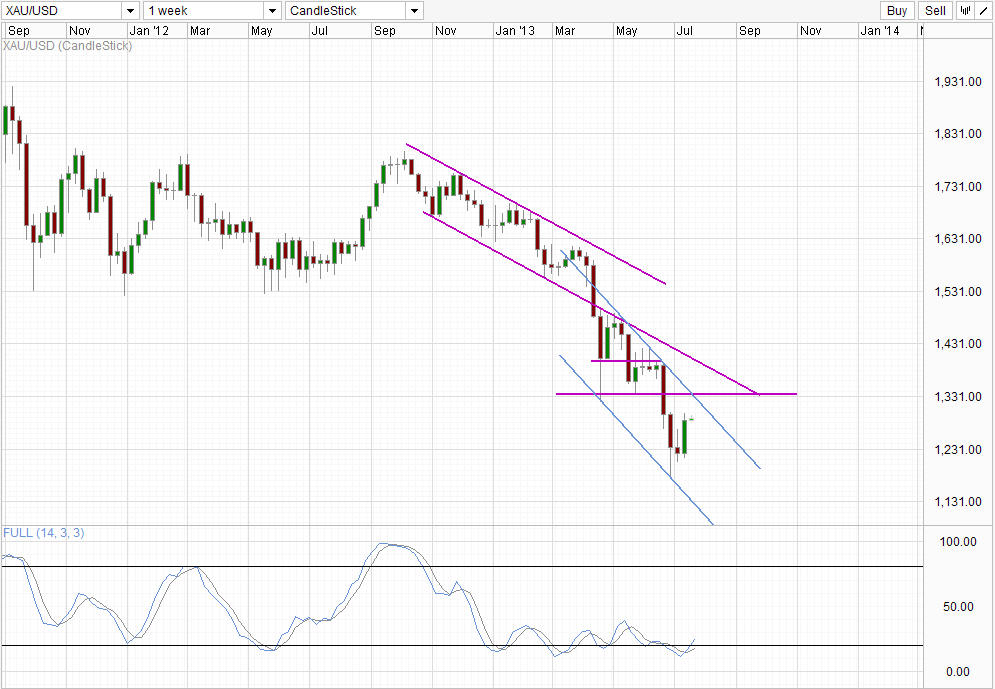
From a technical perspective, we are looking at a potential bullish reversal Candlestick pattern – with a Morning Star bullish pattern formed on the weekly chart. Early Asian trade saw prices extending last week’s gain slightly, moving price back up towards the 1,300 – 1,330 resistance. Stochastic readings are also on the verge of signalling a strong bull cycle sign, suggesting that a move upwards is likely, and may even allow price to break the aforementioned resistance band for a test of the descending Channel Bottom (purple color). This would also mean that a break of current steeper decline, which would allow price to alleviate current strong bearish pressure – would potentially allow price to trade horizontally for a few weeks, similar to what we’ve seen in April (post decline) and June 2013.
Hourly Chart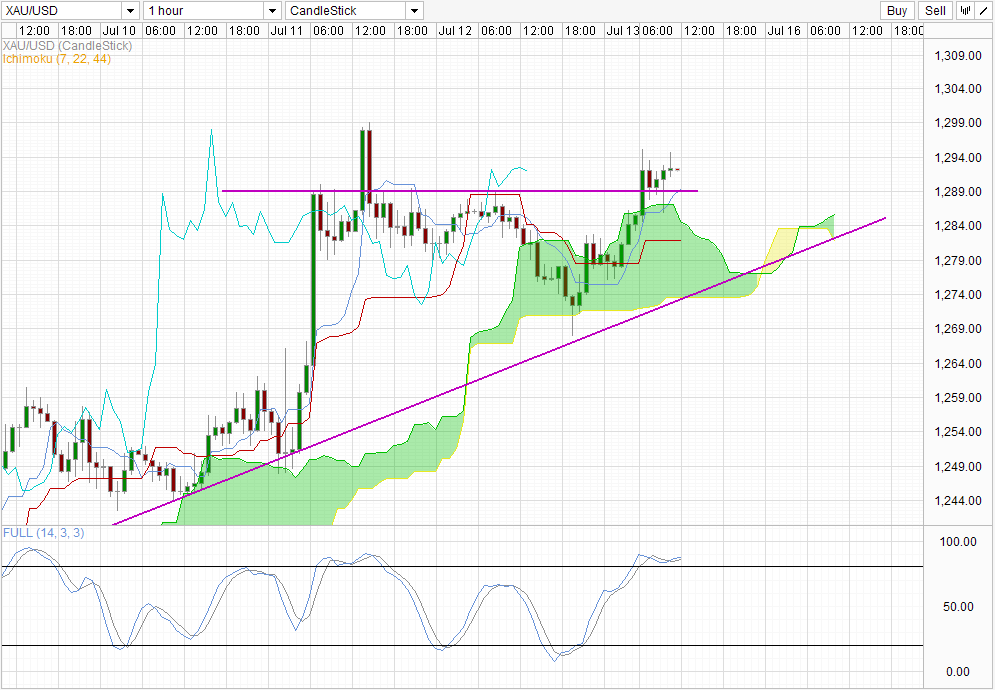
The Hourly Chart is currently above the 1,289 ceiling which will provide some support. Even should price break lower, it is possible that support can be sought from the Kumo, and below which the rising trendline. Forward Kumo is also bullish with a recent bullish “Kumo Twist” which occurred just a few hours prior in conjunction with the break of the 1,289 ceiling, suggesting that a retest towards 1,299, last week’s swing high, is possible. Stochastic readings are currently Overbought, but readings have averted a bearish cycle signal with readings currently pointing higher, suggesting that an interim trough has been in place within the Overbought levels. Furthermore, considering that the longer-term trend is gaining bullish momentum, it is possible that short-term counter-trend signals are less effective given such a situation.
Moving forward, we should keep a keen lookout for this Friday’s COT numbers for both Gold Futures and Gold Physical. Should net position continue to gain, then this would mean that Hedge Funds are buying AND holding, which will put prices in a much better position for a longer bullish correction higher. If speculative net-long positions decrease, then we should discount the Hedge Fund buying news as it would appear that these buyers are simply buying for the short-term dead cat bounce, which puts the recovery towards 1,300 and higher in doubt.
Original post
- English (UK)
- English (India)
- English (Canada)
- English (Australia)
- English (South Africa)
- English (Philippines)
- English (Nigeria)
- Deutsch
- Español (España)
- Español (México)
- Français
- Italiano
- Nederlands
- Português (Portugal)
- Polski
- Português (Brasil)
- Русский
- Türkçe
- العربية
- Ελληνικά
- Svenska
- Suomi
- עברית
- 日本語
- 한국어
- 简体中文
- 繁體中文
- Bahasa Indonesia
- Bahasa Melayu
- ไทย
- Tiếng Việt
- हिंदी
Gold Moves Higher On Speculative Demand
Published 07/15/2013, 02:33 AM
Updated 07/09/2023, 06:31 AM
Gold Moves Higher On Speculative Demand
3rd party Ad. Not an offer or recommendation by Investing.com. See disclosure here or
remove ads
.
Latest comments
please in future gold price updated me
Install Our App
Risk Disclosure: Trading in financial instruments and/or cryptocurrencies involves high risks including the risk of losing some, or all, of your investment amount, and may not be suitable for all investors. Prices of cryptocurrencies are extremely volatile and may be affected by external factors such as financial, regulatory or political events. Trading on margin increases the financial risks.
Before deciding to trade in financial instrument or cryptocurrencies you should be fully informed of the risks and costs associated with trading the financial markets, carefully consider your investment objectives, level of experience, and risk appetite, and seek professional advice where needed.
Fusion Media would like to remind you that the data contained in this website is not necessarily real-time nor accurate. The data and prices on the website are not necessarily provided by any market or exchange, but may be provided by market makers, and so prices may not be accurate and may differ from the actual price at any given market, meaning prices are indicative and not appropriate for trading purposes. Fusion Media and any provider of the data contained in this website will not accept liability for any loss or damage as a result of your trading, or your reliance on the information contained within this website.
It is prohibited to use, store, reproduce, display, modify, transmit or distribute the data contained in this website without the explicit prior written permission of Fusion Media and/or the data provider. All intellectual property rights are reserved by the providers and/or the exchange providing the data contained in this website.
Fusion Media may be compensated by the advertisers that appear on the website, based on your interaction with the advertisements or advertisers.
© 2007-2024 - Fusion Media Limited. All Rights Reserved.