I’ve been in this game long enough that I know making declarative statements does not necessarily add value for the reader. But there is enough evidence to think the gold miners and junior gold stocks have hit bottom.
Last week we wrote about approaching the bottom, and that was a good segue. The gold stocks have been approaching a bottom and the price action to close last week gives us some confidence that a bottom could be in.
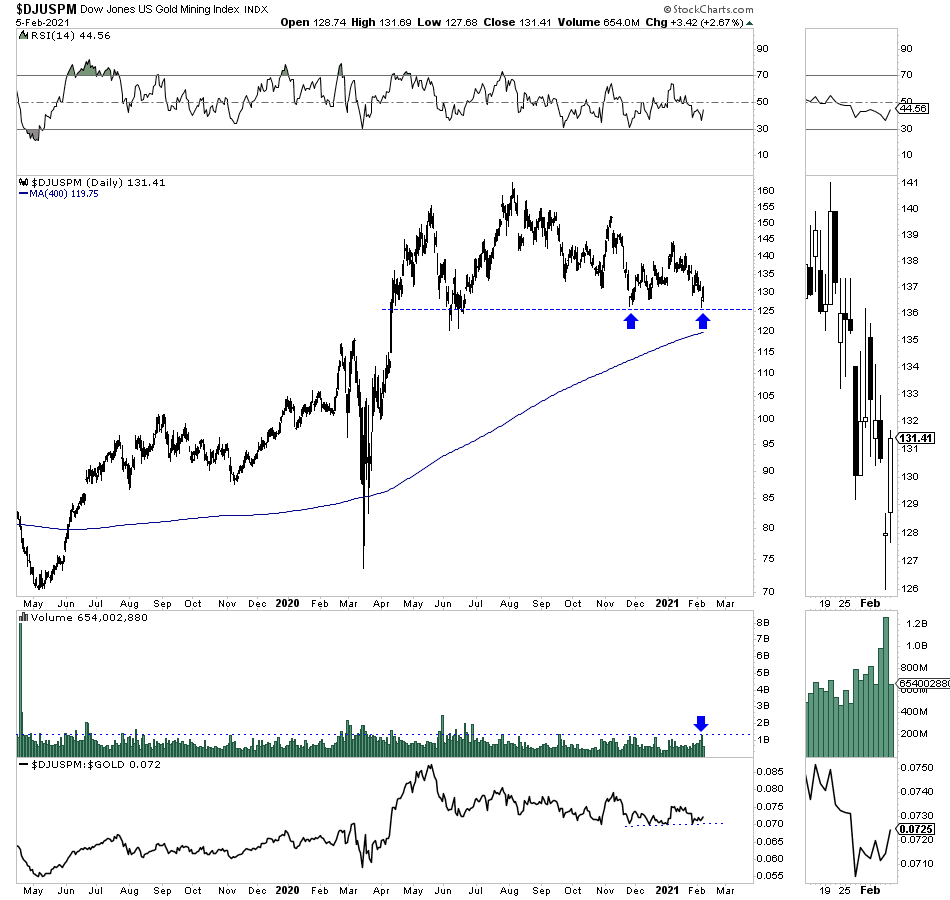
The Dow Jones US Gold (NASDAQ:USAU) Mining Index is weighted heavily amongst the largest gold producers, which have lagged the sector in recent weeks.
However, after gapping down last Thursday, the index formed a bullish reversal and on the largest daily volume in the past 7 months. Also, Thursday’s low was a retest of the November 2020 low, and it marked the 38% retracement from the Covid crash low and 50% retracement from the 2018 low.
A strong bullish candle Friday and a 2.7% gain followed Thursday’s bullish reversal.

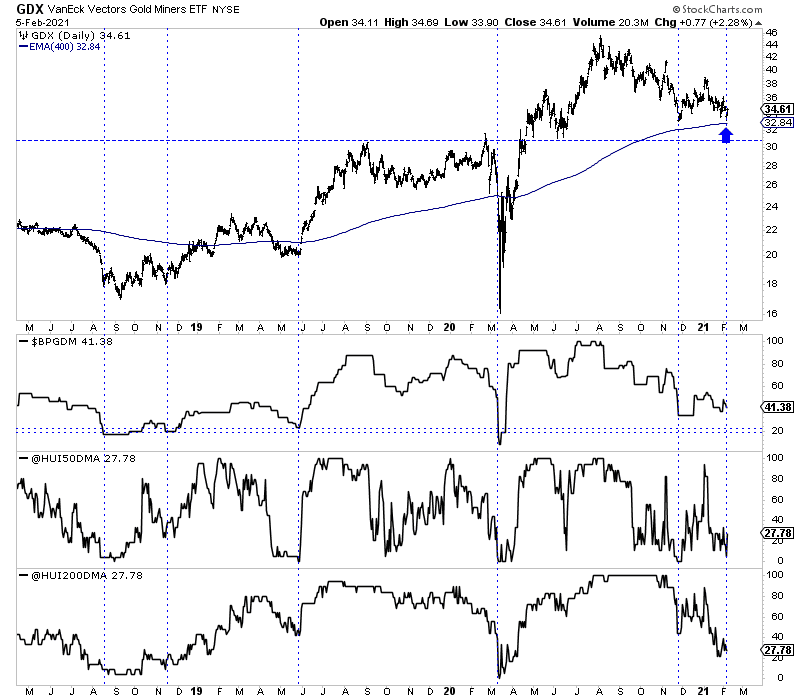
The VanEck Vectors Gold Miners ETF (NYSE:GDX) low last Thursday nearly touched the 400-day exponential moving average (blue arrow), which, as we noted in past articles, provided support for gold stocks during 2001, 2002, 2003, 2005, 2006, 2009, and 2010.
Also, breadth indicators, just before the bullish reversal, hit very oversold levels. For the HUI (GDX without the royalty companies), the percentage of stocks above the 50-day moving average hit a low of 4%, and the percentage of stocks above the 200-day moving average hit 20%.

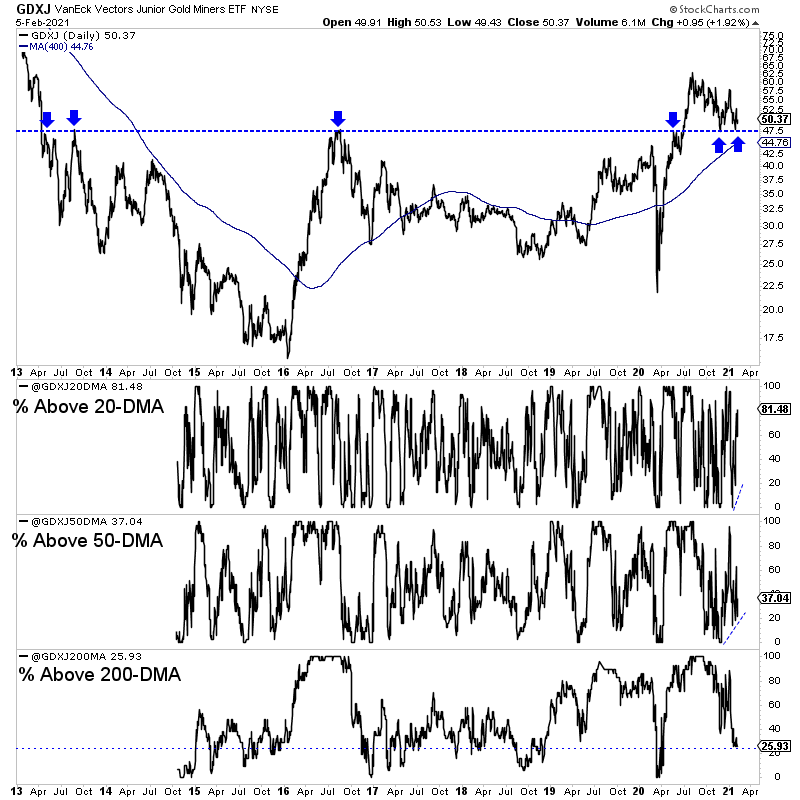
Meanwhile, VanEck Vectors Junior Gold Miners ETF (NYSE:GDXJ) successfully retested the breakout from the 7-year resistance for the second time. Note that the November 2020 low and last Thursday’s lows were a perfect retest of the peaks in 2013, 2016, and 2020.
The short-term breadth indicators show a positive divergence this time, while the long-term (percentage of GDXJ stocks above the 200-day moving average) is very oversold at 26%.

In a bull market, you either buy or you hold.
The late summer and early fall was not a time to buy. Late November was.
This is a time to buy.
It will not be your only buy opportunity this year, but you do not want to pass it up, especially if you are holding too much cash.
There is an interesting set of cross currents, with the dollar rallying, bonds plunging, and stocks soaring. These may not appear bullish for Gold, but if you wait for some perfect opportunity, you risk paying higher prices later.
This year’s goal is to accumulate at good prices (like now) to put yourself in a position to capitalize on the next big breakout, which should take Gold from nearly $2,100 towards $3,000.
