The title does beg the question as to what Gold's price would be were there not the Black Sea Boilover. Most would likely say "lower" than the current 1304 level which Gold posted in closing out the week yesterday (Friday). However, one might surprisingly opine "higher" were the Dollar itself not to have been firming, but instead have continued down rather than up in safe-haven sympathy since Mid-March during the Crisis of Crimea.
Either way, when Gold, as it did early on Thursday, rises 30.6 points in 1 hr. 27 mn., we're curious to quickly do the extrapolative math, therein to discover when at such rate of increase we'd find price eclipse its All-Time High at 1923. The answer is: 31 hrs. 7 mn., which as measured from the commencement of Thursday's thrust, (including the 45-mn. daily trading halt) was sufficiently swift, had it continued, to put price yesterday at a new All-Time High. Funny, as earlier in the week, I'd just chatted with The Gold Update's sole charter reader from nearly five years ago, who remarked that given the right circumstances, we could see Gold now move 200 points in a day, (such courtesy afforded by the COMEX's not imposing daily high/low limits on Gold).
Don't think that it can't happen: on 26 September 2011, Gold from low to high rose by 131.3 points. Or as a percentage example, on 28 September 1999, Gold rose from low to high by 13.8%, and by better than 10% intra-session on each of three individual days in 2008's being the Year of the Black Swan. (And you know a repeat of that debacle is lurking 'round the bend -- or at least one ought be wary of the rationale for it to recur, as with an eye toward the S&P, 'tis "crash-watch" upon which we remain, monsieur).
Indeed in concert with what might go down and later be dubbed as the stock market's "Valuation Detonation", we may well find Gold moving swiftly higher, perhaps as the arrogance of the anti-Gold crowd hits peak pitch. Earlier in the week 'twas in the wee hours we heard an analyst on Bloomy Radio trumpeting on about how securities such as stocks (security?) have attributes by which they can be valued, but that Gold is correlated to nothing and thus its value is simply that which one is willing to pay for it. The interviewee then cockily capped it off with: "If you like Gold, then buy it. Have fun."
I wouldn't put it that way to the Chinese. Nor to the central banks 'round the globe that have Gold stacked up on their balance sheets so as to mitigate the value erosion of their other assets. Nor especially to those sovereign banks in Gold repatriation mode such as Germany and Finland, whose preference is to now have their bars where they can see them. Nor the to analytical models which -- until the last couple of years -- rightly describe the parallel rise in the price of Gold alongside the foundationless increase in money supplies. Want a real example of value simply being that for which one is willing to pay? There is quite a popular stock at present in the S&P 500 currently "valued" per yesterday's close at $303. The company's earnings per share? 60¢ -- meaning its stock buyers are willingly paying $506 for something that earns $1 -- no thanks: that's not my kind of fun, let alone "value".
Still, opportunities are taken to disparage Gold even at the technical level. As one published analyst expressed during the week, “Gold closed last week below its 200-day moving average, which is a bearish technical factor that may pressure the gold market”. What is not therein stated is that since 13 February, Gold per its daily closes has criss-crossed that average five times, (and is currently above it, although our preference is to see price [1304] climb back above the 300-day moving average [1353]).
In fact, in the face of various technical measures that have of late suggested lower levels for Gold, price has instead been ever so firm. Let's start with the stance of Gold's weekly bars within the context of the parabolic Short trend, which in its run now of four weeks has recorded three of them as actually up:
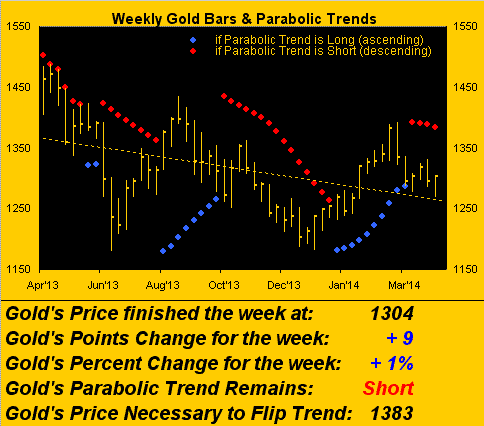
As for Gold's price being back above 1300, let's recall from last week's missive that "The oft-mentioned 1290-1275 support zone which has done its job time and again when tested is now likely surrendering its duties to 1300 itself ... 'Twould behoove Gold to return quickly above 1300, else risk giving back a goodly portion of the year's gains to bang about in the 1280-1240 structural support zone." So far, so good, albeit in the carryover of the Easter holiday, trading across our BEGOS Markets spectrum was somewhat thin this past week, and given the absolutely packed economic data calendar (plus FOMC meeting) in the ensuing week, along with more on Crimea, earnings and so forth, 'tis possible next Saturday we'll remark that "We're not in Kansas anymore".
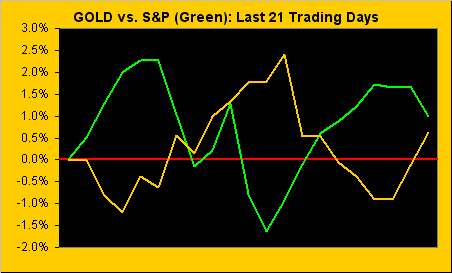
And with the S&P continuing its pattern of rising for several days only to give it all back in one fell swoop, you have to wonder how much longer traders-at-large, especially those on the BuySide, will continue to withstand this kind of market anxiety. The good news therein for Gold is that upon stocks' demise our metal ought rise -- at least given the almost perfectly inverse correlation of Gold vs. the S&P. Here are their percentage tracks over the past 21 days, (and should the green line plunge...):
Further defying of what appeared as negative technicals a week ago is next brought to light in this now updated two-panel graphic for both Gold (left) and Silver (right) showing their month-to-date daily bars and MACD (moving average convergence divergence) studies. Note the lack of material downside followthough despite last week's negative MACD crossings, which are now reversing toward positive:
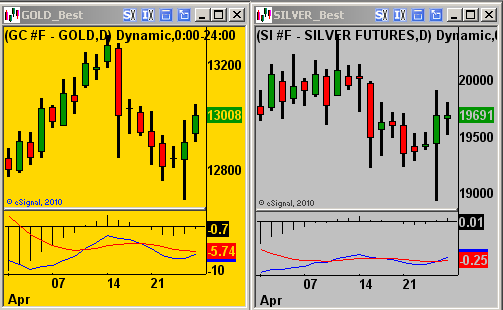
To repeat that which a great and good trading colleague remarks on occasion: "Well, if it can't go down, then it's gonna go up".
And in that very vein we next turn to Gold's "Baby Blues" which measure the consistency of price's 21-day linear regression trend. In the following three-month graphic of Gold's daily bars, take note through the center of the chart of the blue dots falling astride price; but then most recently their having instead remained firm despite the price dip of the last two weeks:
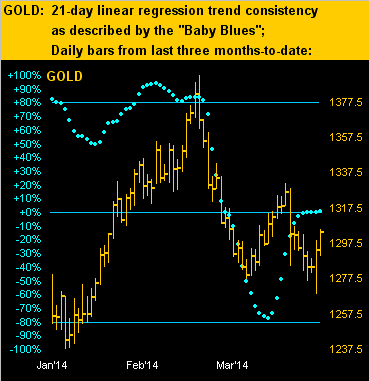
"Well, if it can't go down, then it's gonna go up!"
We just said that, Squire.
"I know, mmb, but it's fun!"
What would really be fun is 1500 for Gold by year-end. Still, in spite of the reality that Gold is not bound by COMEX price limits and therefore can move a great distance in a single session, we remain respectful of the pricing structure since the All-Time High as shown below with weekly bars, the current 1303.6 level in the margin at right:
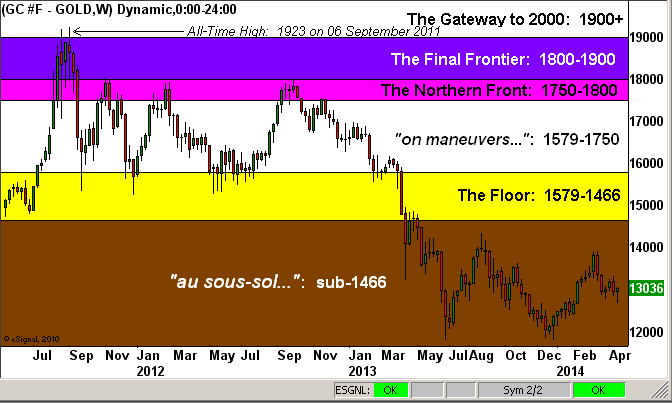
Is our notion of reaching the bottom of The Floor at 1466 still achievable by mid-year? Let's answer that question with another: given Gold's aforementioned move of +30 points on Thursday in less than 90 minutes, might it be able to move from 1304 to 1466 (+126 points) during the next 45 trading sessions, (through 30 June)? To again answer with another -- indeed the most important -- question: am I selling my Gold? No.
Gold positives abound. The Dollar, as cited having firmed during the Ukraine/Russia confrontation, is nonetheless seeing the 80.000 level on the Index morph from support into resistance. That suggests once the ongoing territorial tusslings work their way off of the front pages, the Dollar ought resume in working its way lower. As for Russia itself, we saw S&P cut the debt rating there to but one pip above "speculative" grade on concerns of "additional significant outflows from the economy of both domestic and foreign capital". Meanwhile in the EuroZone, Mario Draghi on behalf of the ECB said they would consider broad-based purchases of assets if the outlook for future consumer-price growth weakens too much, (in spite of the excitement over Spain's economic recovery gaining momentum, its national output growing at the fastest rate in six years -- which if one runs the numbers really isn't saying very much). And now for a fourth straight month we find that China's factory activity has shrunk yet again. Those are Gold stimulants one and all, however the biggest boost for the yellow metal will come from its having to play "catch up" to keep pace with monetary accommodation, the current StateSide rate alone of which will be running at $45 billion per month following the new week's FOMC follies on Wednesday.
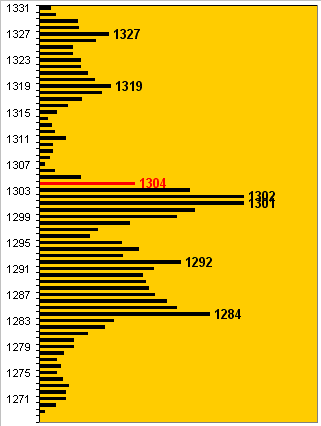
To Gold's 10-day Market Profile we go, the length of the horizontal bars representing the volume of contracts traded per price point, and the red bar being the week's settle at 1304. Note the trading support just above 1300 as well as at 1292 and 1284, with the upside resistors at 1319 and 1327 ripe for the taking:
Finally, with respect to our regularly replenished Golden Spirits Department, the FinTimes has weighed in with this report, enough to curdle one's French blood: "China’s crackdown on the 'erotic sector' as part of an official anti-extravagance drive is posing a serious threat to the cognac industry, as Beijing closes karaoke and hostess bars where European drinks companies make a large chunk of their mainland profits." I suppose those of us loyal to the cognac cause, indeed in doing our mitigative part to such crackdown, ought simply increase our bottoms up...