And oh how biting were those dirty dogs! Dare we query "Who let the dogs out?"--(Baha Men, 2000). No 'twasn't those guys. But at 23:03 Pacific Time precisely on Wednesday night, (which conveniently pointed the Thursday finger at both Asia's pre-close and Europe's pre-open), some flea-bitten mongrel barked "Hey watch this!" and promptly sold 3,000 COMEX Gold contracts at the market causing an instantaneous cavalcade of hoovering underlying bids and stops.
Can we prove it was a one-off trade by a single entity? Of course not ... but it sure had that doggy-smell stench about it as Gold had 10 points bitten from its rump in two relentless seconds with nary a single "up" bar until having been slammed from 1285 down to 1275. Here's how it looked, each bar in the following volume chart representative of 100 contracts traded, (x 30 bars = 3,000 contracts) during the two-second timeframe encircled across the x-axis:
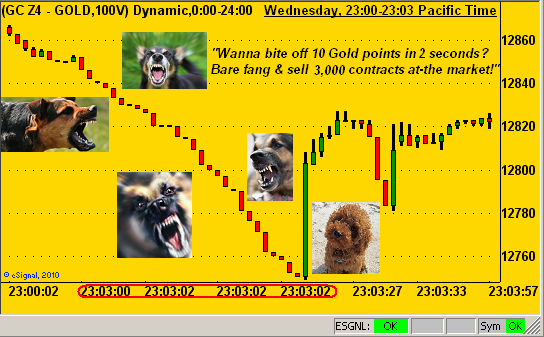
The hideous howlers notwithstanding, a good little guy (just right of center) then deftly stepped in to heroically buy at what turned out to be all but the week's low (1274), sending the otherwise baying curs back into their doghouses. Gold then hobbled higher to finish out the week yesterday (Friday) at 1282.
So much for the traditional lore about the normally docile Dog Days of August, when -- were it not for the permanent marine layer of fog that we've here in frigid summertime San Francisco -- one could gaze up in the pre-dawn hours at Sirius, the resplendent "dog star" marking the head of Canis Major, faithfully at the foot of the hunter Orion in our southeastern sky. To be sure, during the week in the crystalline Rocky Mountains' air up at Jackson Hole, the world's heads of monetary debasement surely saw such brilliant star; but then again, that bunch is always seeing stars. And you know the old saying: were you or I to wish upon a star such that we printed money, we'd be convicted of counterfeiting; but when they so do, 'tis hailed as stimulus. Star light, star bright, ma derriére, it just ain't right, nor hardly fair.
Still, from the logical pro-Gold stance, we say Thank You to FRB Chair Yellen for pointing out that our StateSide labour market has yet to fully recover, (one wonders if the full-time component ever will), and thus the lid remains on rates; we say Thank You to ECB President Draghi for pointing out that the stalling EuroZone economy, (certain nations' GDPs therein actually sliding backward), is increasing the demand for more stimulus; and we say Thank You to Gold for pointing out that through the years it really does not play any currency favourites. Ink those accounting entries, spin those currency printing tumblers and further flood the world with faux dough. Now that ought legitimately give Fido something to bark about!
Moreover, aren't you tired of reading this headline?: "Gold Declines on Fed Rate Outlook". When the FinMedia try to explain Gold's pullbacks, that very mantra is dragged out over and over again. How many times can Gold be repeatedly said to be declining, (which given that 'tis +6.4% for the year really isn't declining), on the same exact set of words? ('Course, when surges by Gold ought be highlighted, there's very little said). 'Twould appear that robotic computers rather than studied brains are the pulling the same headline off of the shelf time and again. Why not instead go with something more evident, such as "Gold Declines on Continued Inverse Correlation to Rising S&P"? Makes more sense to me...
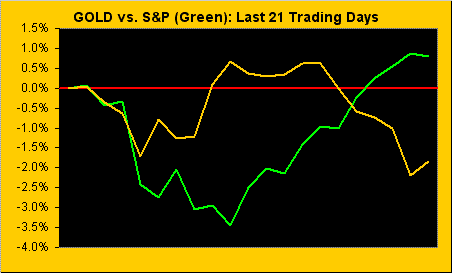
...albeit if the outlook for Fed rates is truly higher, one might consider that as a negative for stocks.
"But mmb, don't stocks first go up anyway with rising rates 'cause it means the economy is getting better?"
Squire, I am happy to see even you plowing into historical correlations. Well done, son. He's got a point.
In any event, specific to the week just past as we update the Weekly Gold Bars chart, the rising parabolic Long trend per the blue dots is now under threat of being flipped to Short should price trade down through 1267 in the ensuing days:
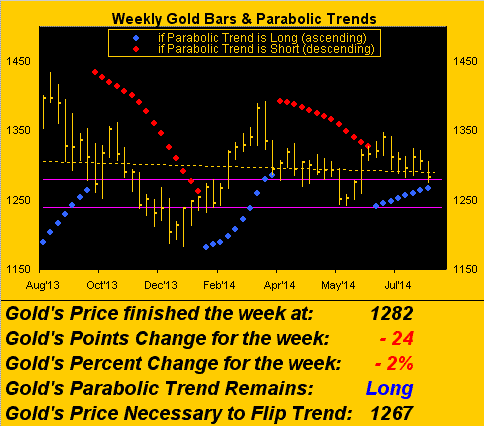
There is additional technical near-term pressure on Gold's price as both the daily MACD (moving average convergence divergence) study as well as the daily "price oscillator" study turned negative during the week; more broadly however, should price further slip, we look for the 1280-1240 support zone between the purple lines in the above chart to again contain price, albeit the parabolic trend would flip to Short.
In fact toward keeping our fundamental hat firmly in place, from Europe eastward 'round through China, manufacturing activity is slowing; add to that the intensifying of "geo-jitters", et voilà, our Dollar, Bond and S&P all are getting the bid, indeed so much so that one might think Gold ought be plunging rather than simply ebbing and flowing along as it appears across the prior chart. Meanwhile for us here StateSide -- and there's no question that our Economic Barometer is again clearly rising -- we received during August reports of declines in Retail Sales, the New York State Empire Index, and the Michigan Sentiment Survey. How many part time jobs are you having to hold down these days? Either way, the Econ Baro is resuming its robust route upward...
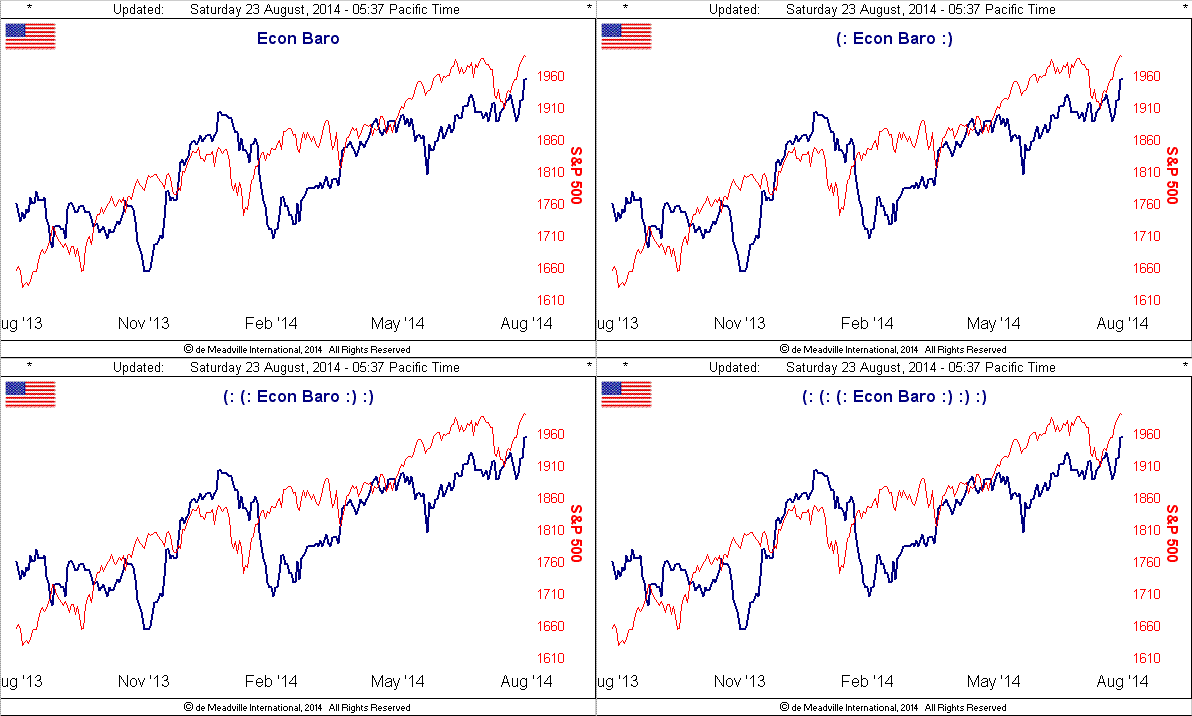
...and yet Gold again by that weekly bars chart, is essentially in consolidation mode, (Wednesday night's two-second dog-pounding notwithstanding). As for the S&P 500, at 1988.40 'tis itself within a day's upside trading range or so of tapping Two-Thousand. And the sooner the traders can get it over with, the better, for as this next graphic shows, the amount of moneyflow it takes to move the S&P one point is getting thinner and thinner:
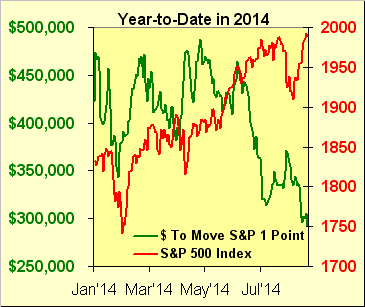
Puts one in mind of that 1977 hit by Jackson Browne entitled "Running On Empty". Add in a dose of "Look Ma: No Real Earnings Growth" and, well, you know...
Unlike the let's-fake-'em-fer-as-long-as-we-can-take-'em stock market, the precious metals truly wear their hearts, or in this next case their baby blue dots, on their sleeves. The following two-panel graphic -- Gold on the left and Silver on the right -- of their respective daily bars for the three months-to-date depicts the "Baby Blues" measure of 21-day linear regression trend consistency. Gold's dots are smack on the 0% axis, meaning its most recent 21-day stint is completely inconsistent; but in terms of wearing one's dots on one's sleeve, Sister Silver has indeed gone sleeveless:
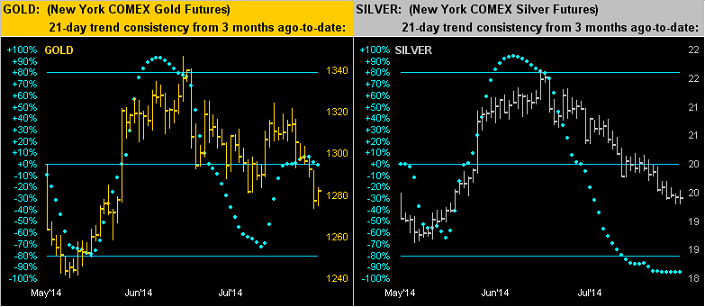
You may recall a week ago the chart which pointed out the negative 13/89 "exponential moving average" negative crossover on Silver's daily bars such that she could dip into the 18s or possibly even the 17s. Prescient Commentary during the week noted our Silver Market Rhythm downside target of 19.445 as having already been reached, price then slipping further to as low as 19.285. But given Sister Silver's fully consistent ripping down the straightaway at right in the above graphic, someone ought alert her pit crew to radio the car with the calm reminder that 'tis the center pedal which applies the brakes, luv. Mercy!
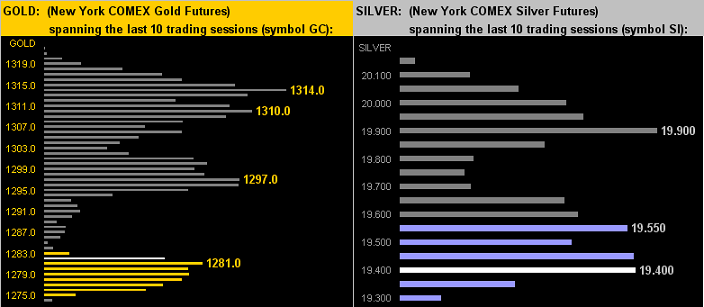
To the Market Profiles we go, (the white bar in each panel below being Friday's settle). On the left for Gold, despite the dogged dip it endured per our opening chart, trading support did then get built in per the 1281 apex, with further upside trading resistors as therein noted. On the right for Silver we've the overhead resistance at both 19.550 and 19.900:
All of which in turn brings us to the State of the Stack:
The Gold Stack:
Gold’s All-Time High: 1923 (06 September 2011)
The Gateway to 2000: 1900+
The Final Frontier: 1800-1900
The Northern Front: 1750-1800
On Maneuvers: 1579-1750
Structural Resistance: 1479 / 1524-1535
The Floor: 1466-1579
Le Sous-sol: Sub-1466
Year-to-Date High: 1392
Base Camp: 1377
10-Session directional range: 1322 down to 1273 = -49 points or -4%
The 300-day Moving Average: 1301
10-Session “volume-weighted” average price magnet: 1298
Trading Resistance: 1297 / 1310 / 1314
Neverland: The Whiny 1290s
Gold Currently: 1282, (weighted-average trading range per day: 13 points)
Trading Support: 1281
Support Band: 1280-1240
The Weekly Parabolic Price to flip Short: 1267
Structural Support: 1266 / 1227 / 1163 / 1145
Year-to-Date Low: 1203
Next week is the StateSide drive into Labor Day Weekend. 'Tis a hefty calendar of incoming data for the Economic Barometer and 'twill be a Big Weekend for us as we'll pen our 250th consecutive Saturday edition of The Gold Update. And therein we'll take you though a calculation that reasonably, indeed conservatively if not flat-out irrefutably ought have Gold already over $2,000/oz. Just in time to impress your friends at that holiday weekend barbecue where we'll really let the dogs out! See you there!