Gold is consolidating the recent rally. That rally (basis December futures) moved the price from the $1210 area up to about $1280.
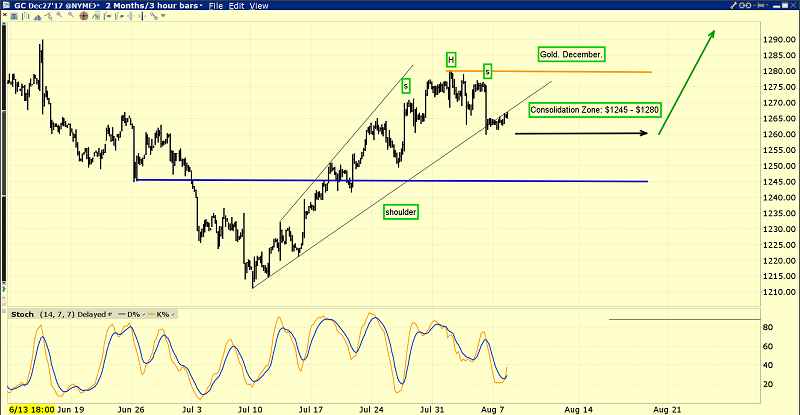
This is the short-term gold chart.
There’s a small head & shoulders top pattern in play, and commercial traders have been selling gold and shorting in that top area.
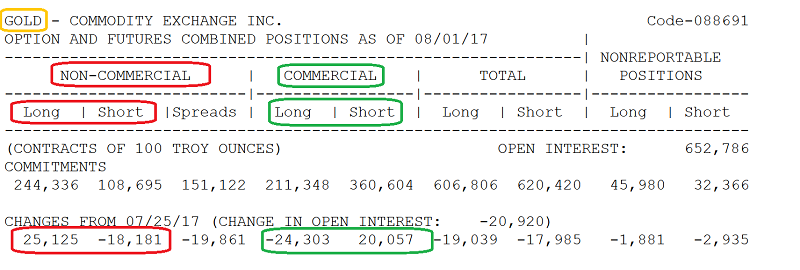
When commercial traders add short positions into a gold price rally, a pause in the upside action often follows.
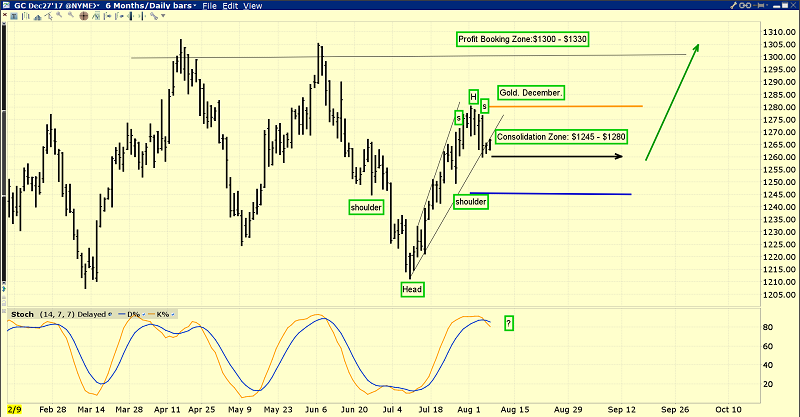
This is the daily gold chart.
Note the 14,7,7 Stochastics series crossover sell signal on the chart. A few weeks of consolidation would bring down this overbought oscillator.
That would put gold in a nice technical position just as Diwali buying gets underway. Indians are always eager buyers into gold price weakness, and so are Western commercial traders. If a gold “price sale” happens at the same time as an event like Diwali, commercial traders tend to be very aggressive buyers.
With the consolidation now apparently underway, gold bugs can nibble at the price in the $1245 - $1260 area. My suggestion is not to predict that the price goes there, but to be prepared to do some light buying if it happens. My own focus for fresh buys in the consolidation zone is GDX, the gold stocks ETF.
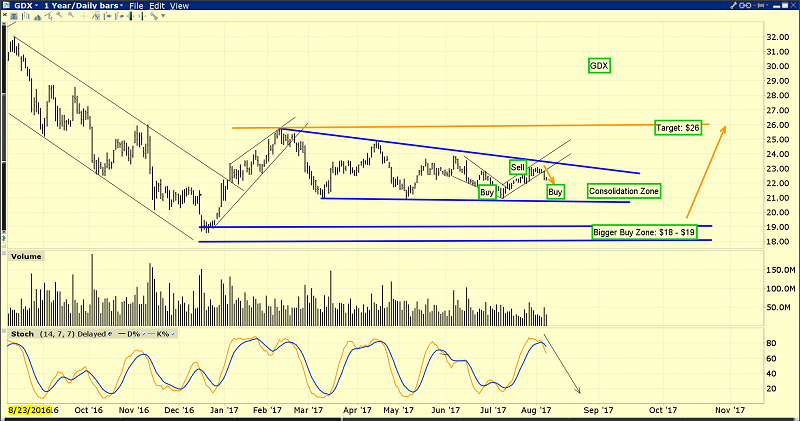
I’m quite an aggressive GDX buyer in the $22 - $18 area, and a seller (of some) in the $23 area.
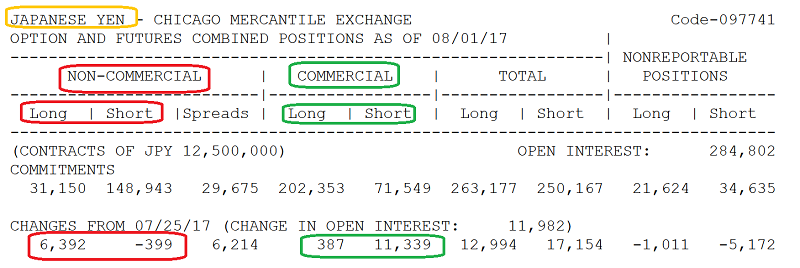
This is another important COT report. It’s for the Japanese yen versus the US dollar.
As expected, the commercial traders are shorting the yen into the rally. What is much more interesting is the overall size of the long position they hold. It’s truly enormous.
This is important because the yen is a key “risk-off” currency like gold. The US debt ceiling is becoming a concern. If congress refuses to raise the ceiling, it could create a financial earthquake in the US government bond market.
In turn, that would create an epic risk-off event, sending both the yen and gold higher. If that happened, the commercial traders would likely sell a big portion of their huge long yen position at a fat profit.
Also, Japan may be poised to finally raise interest rates in 2018. That’s another event that could send both gold and the yen soaring against the dollar.
In addition, I think most analysts are seriously underestimating the commitment of Donald Trump to lowering the value of the dollar. He’s doing it to make American debt more manageable.
The bottom line is that there’s a global currency war going on, Trump is winning it, and the dollar faces tremendous headwinds from all directions.
Some investors have asked me if a fall in the bond market would trigger a stock market “melt-up”. The answer is that just as gold sometimes rallies and sometimes declines when rates are hiked, the US stock market can rally or decline when rates rise.
The current pace of rate hikes has done no harm to the stock market. If it continues, the stock market can theoretically keep rallying. If something goes wrong (perhaps quantitative tightening), and the bond market crashed, the stock market would almost certainly crash too, even though it’s not a bubble market.
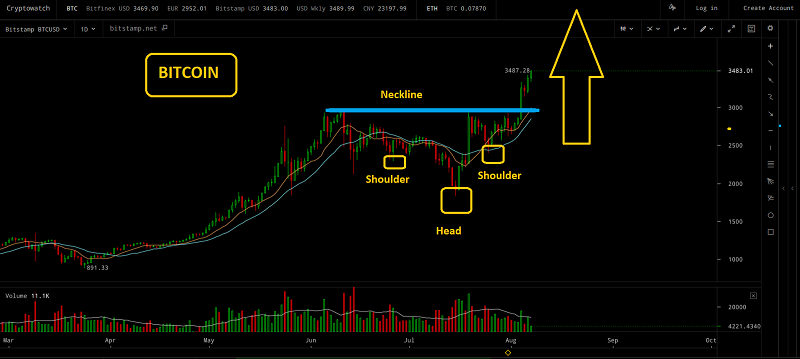
This is the fabulous bitcoin chart. I’m adamant that investors should be well-diversified in their quest to build wealth and retain it.
I view blockchain currency as the hottest sub-sector of the precious metals asset class. At gublockchain.com I cover the intense price action for bitcoin and many other blockchain currencies.
In the case of bitcoin, it just blasted out of a beautiful inverse head and shoulders bottom pattern. It appears to be making a beeline to my $4000 price target for that pattern. Eager wealth builders can be modest sellers in the $3800 - $4200 area.
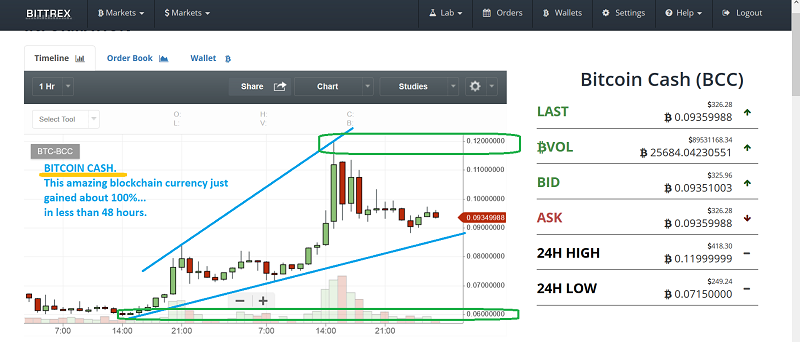
On August 1, 2017 bitoin investors received free “bitcoin cash” currency, the result of a “hard fork” in bitcoin.
I view the bitcoin cash spinoff as a gargantuan dividend, and it just surged about 100% higher… in less than 48 hours.
While blockchain is the current star of the upside action show, gold bullion, silver bullion, and the yen may be poised to join the fun in the key September and October months that I refer to as “US stock market crash season.”
Stewart Thomson is a retired Merrill Lynch broker. Stewart writes the Graceland Updates daily between 4am-7am. They are sent out around 8am-9am. The newsletter is attractively priced and the format is a unique numbered point form. Giving clarity of each point and saving valuable reading time.
Risks, Disclaimers, Legal
Stewart Thomson is no longer an investment advisor. The information provided by Stewart and Graceland Updates is for general information purposes only. Before taking any action on any investment, it is imperative that you consult with multiple properly licensed, experienced and qualified investment advisors and get numerous opinions before taking any action. Your minimum risk on any investment in the world is: 100% loss of all your money. You may be taking or preparing to take leveraged positions in investments and not know it, exposing yourself to unlimited risks. This is highly concerning if you are an investor in any derivatives products. There is an approx $700 trillion OTC Derivatives Iceberg with a tiny portion written off officially. The bottom line:
Are You Prepared?
