
- SPX Monitoring purposes; Long S&P 500 on 5/31/22 at 4151.09.
- Monitoring purposes GOLD: Long VanEck Gold Miners ETF (NYSE:GDX) on 10/9/20 at 40.78.
- Long Term SPX monitor purposes; Neutral

Yesterday we said:
“We have the Bollinger Bands on the SPY chart above and notice that these Bollinger Bands are pinching which in turn suggests a large move is not far off. The Bollinger Bands don’t give the direction of the move just that a large move is coming. The direction of the move in our opinion will be up in that panic has been present over the last couple of weeks and the McClellan Oscillator is above “0” (closed Friday at +45 and there is a positive A/D line today suggesting a higher McClellan Oscillator today). As long as the McClellan Oscillator remains above “0” the short term trend will be up.”
Today the A/D line was again strong with a 7/1 advancing to declining and with up volume to down volume of near 6/1. This is the type of statistics one wants to see of a potential bottom.
Yesterday we said:
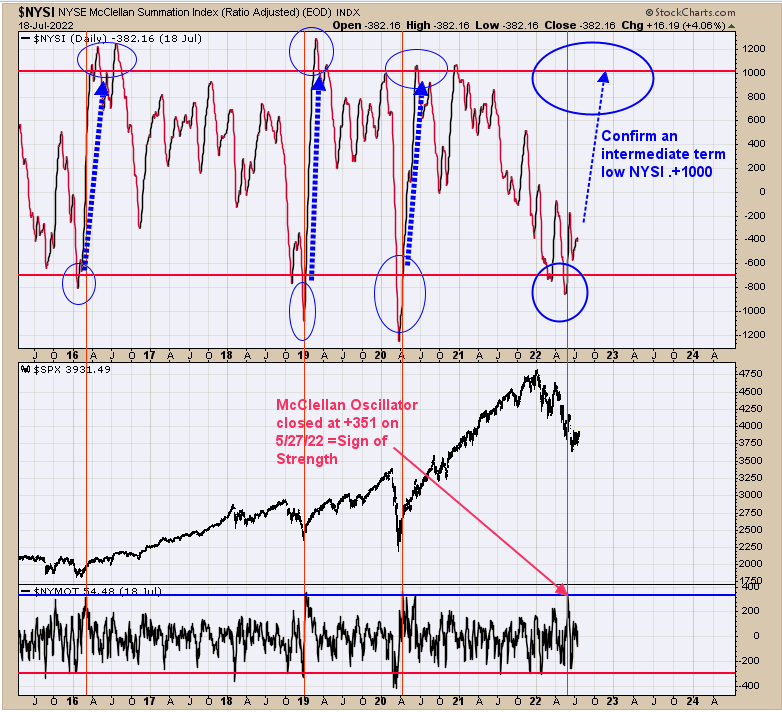
“The top window is the NYSE McClellan Summation index. Intermediate term lows have confirmed when the Summation index falls below -700 (exhaustion to down side) and then rallies to +1000 in two to three months. The -700 Summation index was reached in mid May and add three months would be mid August for the +1000 Summation index to be reached. My point is that for an intermediate term low to be confirmed, this current rally would need to continue for the Advance/Decline to continue in a bullish fashion. The TRIN and TICK closes over the last couple of weeks did produce enough panic for the rally to continue.”
Yesterday A/D line was near 5/1 and today 7/1; Up volume to down volume yesterday was 4/1 and today 6/1. These type of bullish readings will need to continue for the NYSE Summation index to reach +1000 in the near future; we are thinking this is possible. Side note, FOMC meeting is July 26-27 and could have a short term affect on the market.
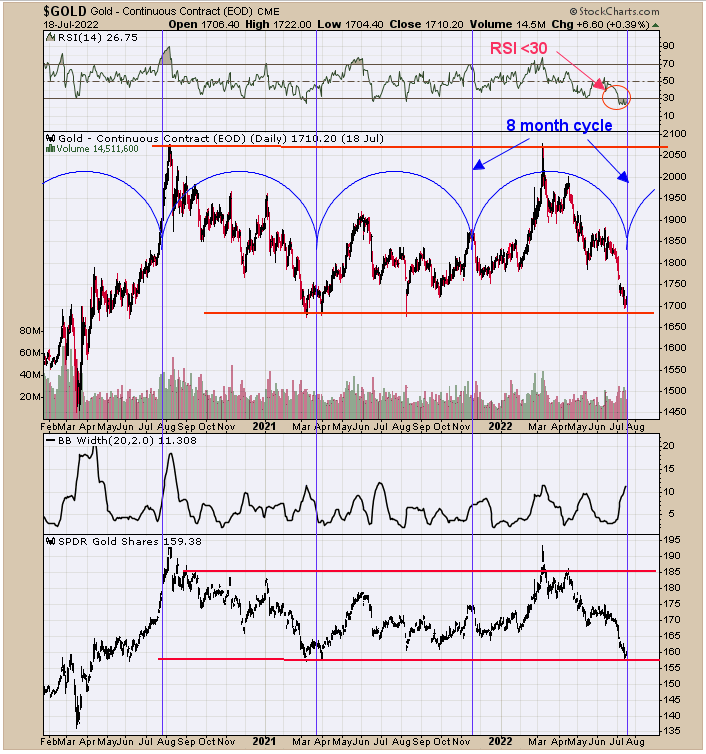
Above is the 8 month cycle for gold. This chart goes back over two years. The next 8 month cycles for gold come in the next couple of days (noted with a blue vertical line). Notice also that the RSI for Gold is below 30 showing an oversold condition and this RSI oversold condition is coming on the heals of a test of a previous low. Gold has been trading sideways since mid 2020 building cause for the next breakout. For very short term gold appears to be near a low and is due for a rally. With a sideways pattern lasting two years on Gold a breakout is due.