
The well respected chartist Clive Maund who is no gold bug and does his work strictly by the rules of technical analysis concludes that the current price charts for both gold and silver show classic price bottoms for the two precious metals (see below).
The graphs below speak for themselves. The reverse head-and-shoulders pattern is a classic trend reversal pattern. It has been observed many times before in financial charts. Here’s gold: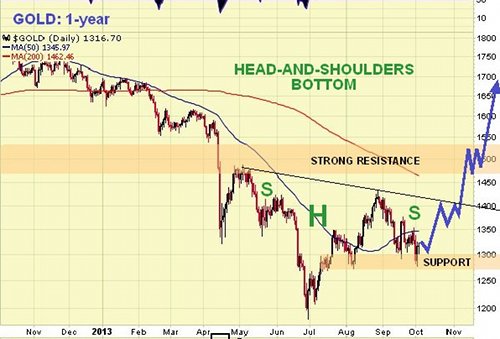
Given the close alliance between the two monetary metals it should be no surprise to see a more volatile version of the same thing in the silver chart: 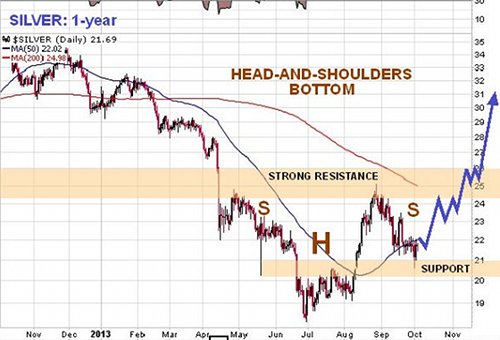
Could investors be fretting about the stock market when they ought to be just getting on with buying more gold and silver? If the technical charts are right then that is the only conclusion.
Besides is not the more obvious outcome of the Washington debacle this week a last minute solution? That would send stocks soaring back up and take the precious metals up too. QE to infinity is rocket fuel for asset price inflation and gold and silver are the classic inflation hedges.
Maybe that is the fundamental backdrop to this piece of technical analysis.
- English (UK)
- English (India)
- English (Canada)
- English (Australia)
- English (South Africa)
- English (Philippines)
- English (Nigeria)
- Deutsch
- Español (España)
- Español (México)
- Français
- Italiano
- Nederlands
- Português (Portugal)
- Polski
- Português (Brasil)
- Русский
- Türkçe
- العربية
- Ελληνικά
- Svenska
- Suomi
- עברית
- 日本語
- 한국어
- 简体中文
- 繁體中文
- Bahasa Indonesia
- Bahasa Melayu
- ไทย
- Tiếng Việt
- हिंदी
Gold And Silver Price Charts Both Show Classic Bottoms
Published 10/11/2013, 10:43 AM
Updated 07/09/2023, 06:31 AM
Gold And Silver Price Charts Both Show Classic Bottoms
Latest comments
Loading next article…
Install Our App
Risk Disclosure: Trading in financial instruments and/or cryptocurrencies involves high risks including the risk of losing some, or all, of your investment amount, and may not be suitable for all investors. Prices of cryptocurrencies are extremely volatile and may be affected by external factors such as financial, regulatory or political events. Trading on margin increases the financial risks.
Before deciding to trade in financial instrument or cryptocurrencies you should be fully informed of the risks and costs associated with trading the financial markets, carefully consider your investment objectives, level of experience, and risk appetite, and seek professional advice where needed.
Fusion Media would like to remind you that the data contained in this website is not necessarily real-time nor accurate. The data and prices on the website are not necessarily provided by any market or exchange, but may be provided by market makers, and so prices may not be accurate and may differ from the actual price at any given market, meaning prices are indicative and not appropriate for trading purposes. Fusion Media and any provider of the data contained in this website will not accept liability for any loss or damage as a result of your trading, or your reliance on the information contained within this website.
It is prohibited to use, store, reproduce, display, modify, transmit or distribute the data contained in this website without the explicit prior written permission of Fusion Media and/or the data provider. All intellectual property rights are reserved by the providers and/or the exchange providing the data contained in this website.
Fusion Media may be compensated by the advertisers that appear on the website, based on your interaction with the advertisements or advertisers.
© 2007-2024 - Fusion Media Limited. All Rights Reserved.