We haven’t done an update on gold and gold stocks since the end of February. The reason for this is that their charts have been broken. As technicians, we look at price, volume, trend, strength, sentiment etc. to help us determine the likely path of a security. But, when price breaks down hard it skews the chart pattern so badly that the most important component for technical analysis (price) becomes of little value (other than the obvious message that the stock is broken). As a result, all we can do is wait for enough time to pass for the stock to reassert a readable pattern. Finally we’re starting to see a trickle of information from precious metals charts.
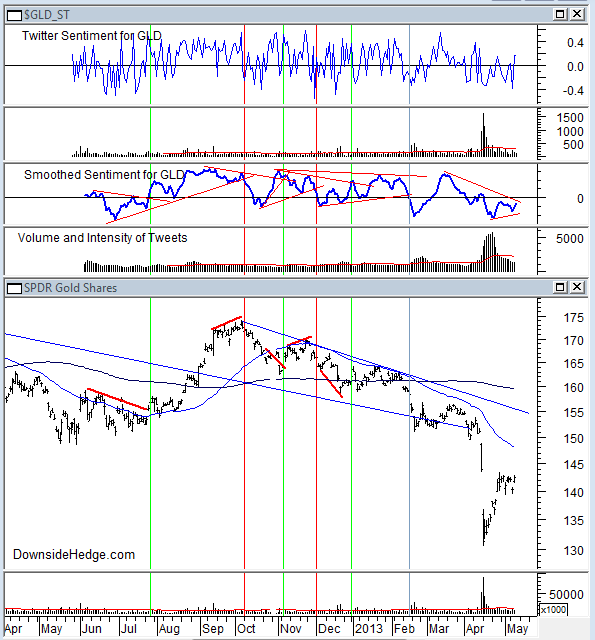
In early February when the SPDR Gold Shares ETF (GLD) was trading above 160 and bouncing against the underside of its short term down trend line we gave up almost all bullish hope for the metal. By the 13th of February we stated that if GLD traded back down to 150 that the Market Vectors Gold Miners ETF (GDX) “...will almost certainly break below $39 in a very sharp and very ugly way.” which ended up being the case. On the next day, Twitter sentiment for GLD broke down and we ended the counter trend bounce signal from sentiment (indicated by the vertical blue line on the chart below) and determined that the down trend was resuming.
We’re now starting to see some meaningful information. It’s not a lot so don’t get too excited, but at least we have something to watch. First we want to point to volume and price when GLD fell from 150 to 130. The large volume tells us that someone (or lots of someones) capitulated. That capitulation removed some overhead supply which allowed gold to have a good counter trend bounce. Now is where the fun will begin. Will precious metals continue to move up, or will they resume their down trend?
For some clues we’ll look at Twitter sentiment. In the chart above for GLD we’re seeing some weak confirmation of the move up from 130. The fact that this confirmation is weak is a pretty good thing from a contrarian point of view. Not a lot of people are cheering GLD’s move higher as we saw during the rally in Early March. This tells us the chasing of gold is over. People have been shaken and it will take good reasons for them to become buyers. That will add some rationality to the gold market which is needed to sustain a new uptrend.
We’re still a long way away from seeing a counter trend bounce signal because we first need to see a positive divergence from sentiment. The next few downward moves in GLD will give us a clearer picture. It’s not necessary for GLD to break 130 for that condition to appear. There’s plenty of room between current prices and the last lows for some resolution between price and sentiment if it occurs over enough time.
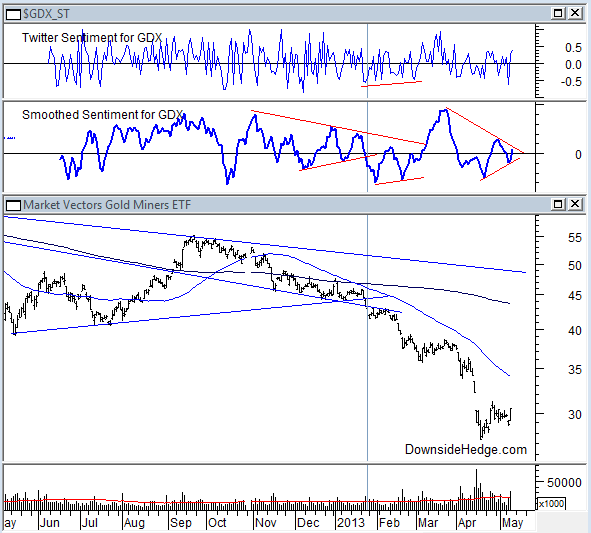
Gold stocks (GDX) are painting a similar pattern to GLD, but with a bit more chasing by traders. If the patterns can hold then gold and gold stocks just may have a chance at creating a durable low. We’ll post another update if we see signs of strength or further breakdown.
- English (UK)
- English (India)
- English (Canada)
- English (Australia)
- English (South Africa)
- English (Philippines)
- English (Nigeria)
- Deutsch
- Español (España)
- Español (México)
- Français
- Italiano
- Nederlands
- Português (Portugal)
- Polski
- Português (Brasil)
- Русский
- Türkçe
- العربية
- Ελληνικά
- Svenska
- Suomi
- עברית
- 日本語
- 한국어
- 简体中文
- 繁體中文
- Bahasa Indonesia
- Bahasa Melayu
- ไทย
- Tiếng Việt
- हिंदी
Gold And Gold Stocks Trying To Bottom
Published 05/12/2013, 12:21 AM
Updated 07/09/2023, 06:31 AM
Gold And Gold Stocks Trying To Bottom
Latest comments
Loading next article…
Install Our App
Risk Disclosure: Trading in financial instruments and/or cryptocurrencies involves high risks including the risk of losing some, or all, of your investment amount, and may not be suitable for all investors. Prices of cryptocurrencies are extremely volatile and may be affected by external factors such as financial, regulatory or political events. Trading on margin increases the financial risks.
Before deciding to trade in financial instrument or cryptocurrencies you should be fully informed of the risks and costs associated with trading the financial markets, carefully consider your investment objectives, level of experience, and risk appetite, and seek professional advice where needed.
Fusion Media would like to remind you that the data contained in this website is not necessarily real-time nor accurate. The data and prices on the website are not necessarily provided by any market or exchange, but may be provided by market makers, and so prices may not be accurate and may differ from the actual price at any given market, meaning prices are indicative and not appropriate for trading purposes. Fusion Media and any provider of the data contained in this website will not accept liability for any loss or damage as a result of your trading, or your reliance on the information contained within this website.
It is prohibited to use, store, reproduce, display, modify, transmit or distribute the data contained in this website without the explicit prior written permission of Fusion Media and/or the data provider. All intellectual property rights are reserved by the providers and/or the exchange providing the data contained in this website.
Fusion Media may be compensated by the advertisers that appear on the website, based on your interaction with the advertisements or advertisers.
© 2007-2024 - Fusion Media Limited. All Rights Reserved.