Get 40% Off
🚨 Volatile Markets? Find Hidden Gems for Serious Outperformance
Find Stocks Now

Gold And Dollar Close To New Bullish Or Bearish Trend

Published 04/09/2017, 12:38 AM
Updated 07/09/2023, 06:31 AM

Is gold bullish or bearish? Is the US dollar bullish or bearish?

We receive this question almost daily from our readers. Seems like it is time for another update on gold and the dollar.

The underlying reason that investors are so interested in both gold and the dollar is because of their perceived inverse correlation. We say ‘perceived’ because their inverse correlation only applies over the very long term, as explained in detail in How To Read The U.S. Dollar Chart And What It Means For Gold Investors. Shorter term, however, both assets are not strongly correlated.

Both gold and the US dollar about to start a new bullish or bearish trend

First, let’s review the US dollar. The long term outlook of the dollar is bullish at this point. We explained the bullish case for the dollar based on the long term US dollar chart. On top of that, we added in our US dollar forecast for 2017 that the 101 level was the line in the sand: once the dollar breaks for at least 3 consecutive weeks above 101 points, it becomes very bullish.

So far the long term USD chart.

On the shorter timeframe, the USD basically confirms the observations and conclusions from the long term chart. In general, that is not often case which leads us to conclude that the picture in the USD is very clear and concise (because similar on the short and long term charts).

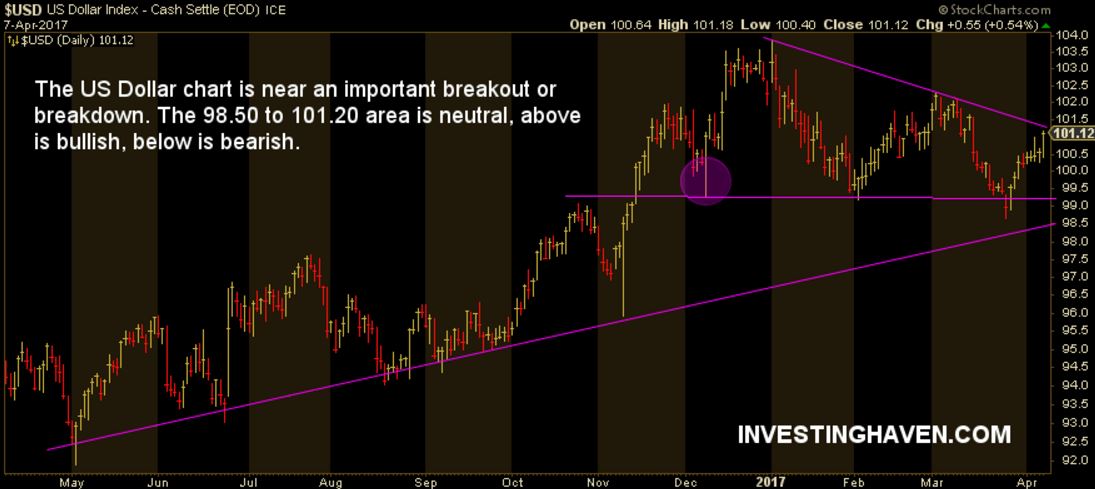
As explained on the chart below, the dollar becomes very bullish above 101 points. Below 98.50, it is bearish on the short to medium term timeframe (secular bearish below 90 points). The chart below suggests that a new trend in the USD is near, given the triangle pattern.
3rd party Ad. Not an offer or recommendation by Investing.com. See disclosure here or remove ads .

US Dollar Index Chart

Gold is currently also in a ‘neutral’ zone, though it is also close to start a new trend. Although the triangle pattern is different than the one on the USD chart, it leads to the same conclusion.

Gold becomes bullish on the short to medium timeframe above $1290. It is bearish below $1220. As said last week, we are watching gold prices closely in April 2017 as a new trend will become clear given the aforementioned price point.

The long term gold chart suggests that gold’s bear market continues until gold breaks above $1350. That is in line with our gold price forecast for 2017.
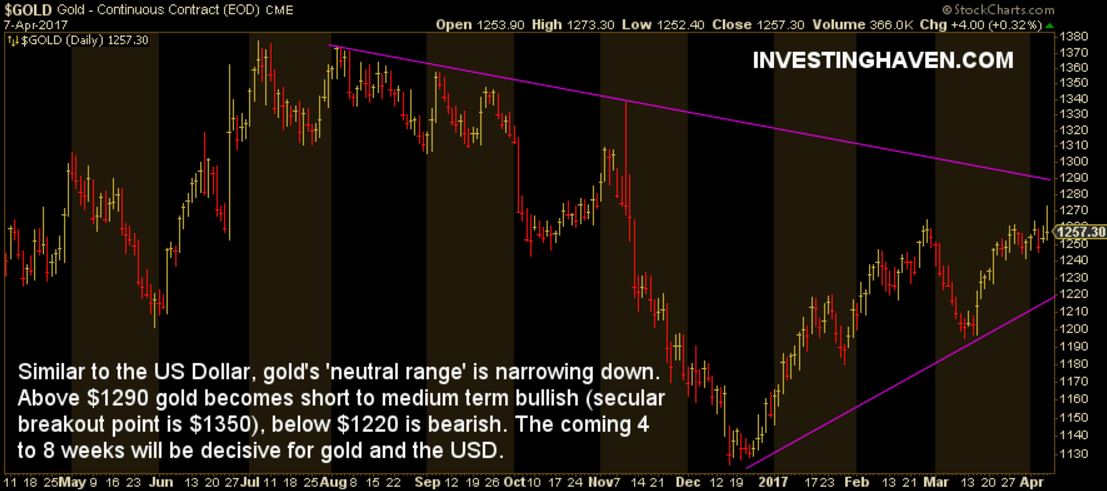
Gold Daily Chart

Original post

Latest comments

Thanks. Sir
Risk Disclosure: Trading in financial instruments and/or cryptocurrencies involves high risks including the risk of losing some, or all, of your investment amount, and may not be suitable for all investors. Prices of cryptocurrencies are extremely volatile and may be affected by external factors such as financial, regulatory or political events. Trading on margin increases the financial risks.
Before deciding to trade in financial instrument or cryptocurrencies you should be fully informed of the risks and costs associated with trading the financial markets, carefully consider your investment objectives, level of experience, and risk appetite, and seek professional advice where needed.
Fusion Media would like to remind you that the data contained in this website is not necessarily real-time nor accurate. The data and prices on the website are not necessarily provided by any market or exchange, but may be provided by market makers, and so prices may not be accurate and may differ from the actual price at any given market, meaning prices are indicative and not appropriate for trading purposes. Fusion Media and any provider of the data contained in this website will not accept liability for any loss or damage as a result of your trading, or your reliance on the information contained within this website.
It is prohibited to use, store, reproduce, display, modify, transmit or distribute the data contained in this website without the explicit prior written permission of Fusion Media and/or the data provider. All intellectual property rights are reserved by the providers and/or the exchange providing the data contained in this website.
Fusion Media may be compensated by the advertisers that appear on the website, based on your interaction with the advertisements or advertisers.
© 2007-2024 - Fusion Media Limited. All Rights Reserved.