Gold has staged a great goal line defense the last 3 months. Is it time for a major move? Let’s take a look...
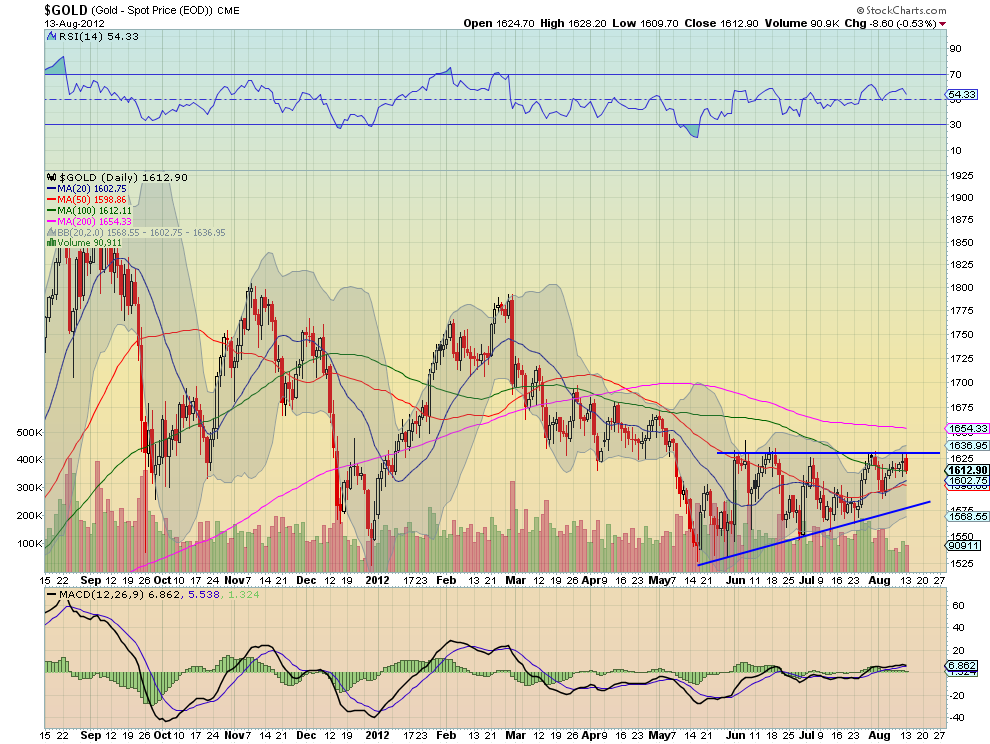
The daily chart can be interpreted as an ascending triangle with a top at 1630 and a target on a breakout higher to 1735. But the Relative Strength Index (RSI) is struggling to turn bullish and the Moving Average Convergence Divergence indicator (MACD) is moving back towards a cross to negative.
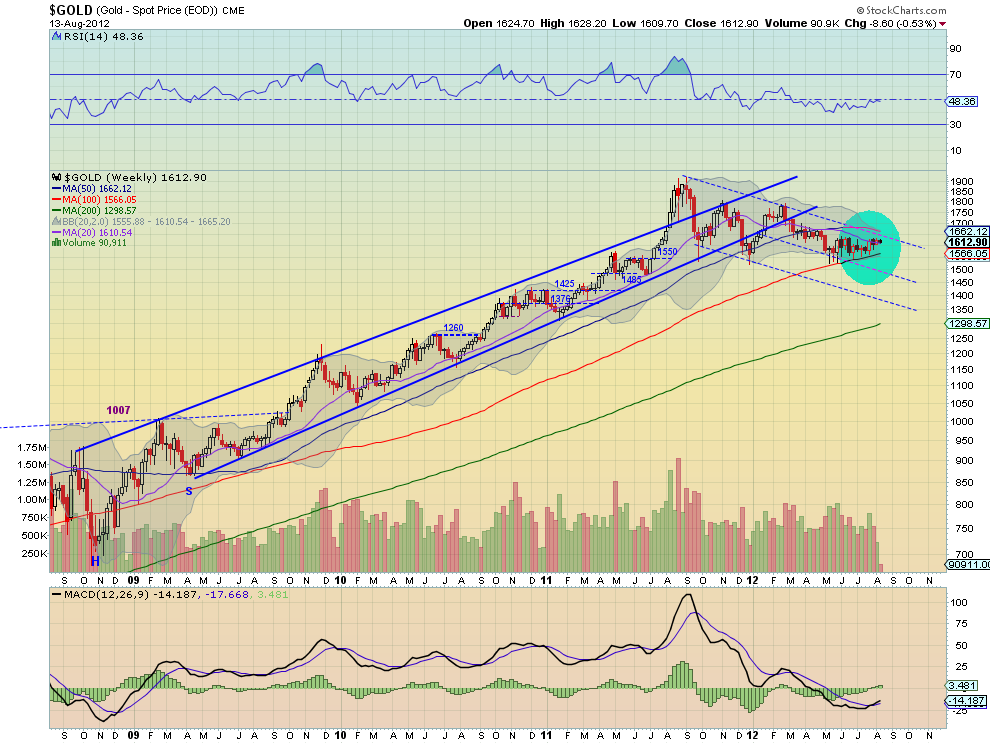
These are not favorable signs. Moving out to the weekly perspective shows shows that the long downtrending channel is still in tact despite the continued move sideways and drift higher. In fact there is still room to move higher without jeopardizing the channel. But notice that the Bollinger bands are getting very tight. The last time they were this tight the price moved from 1470 to over 1900. A closer look also reveals that the RSI is trending slowly higher and the MACD has crossed to positive.
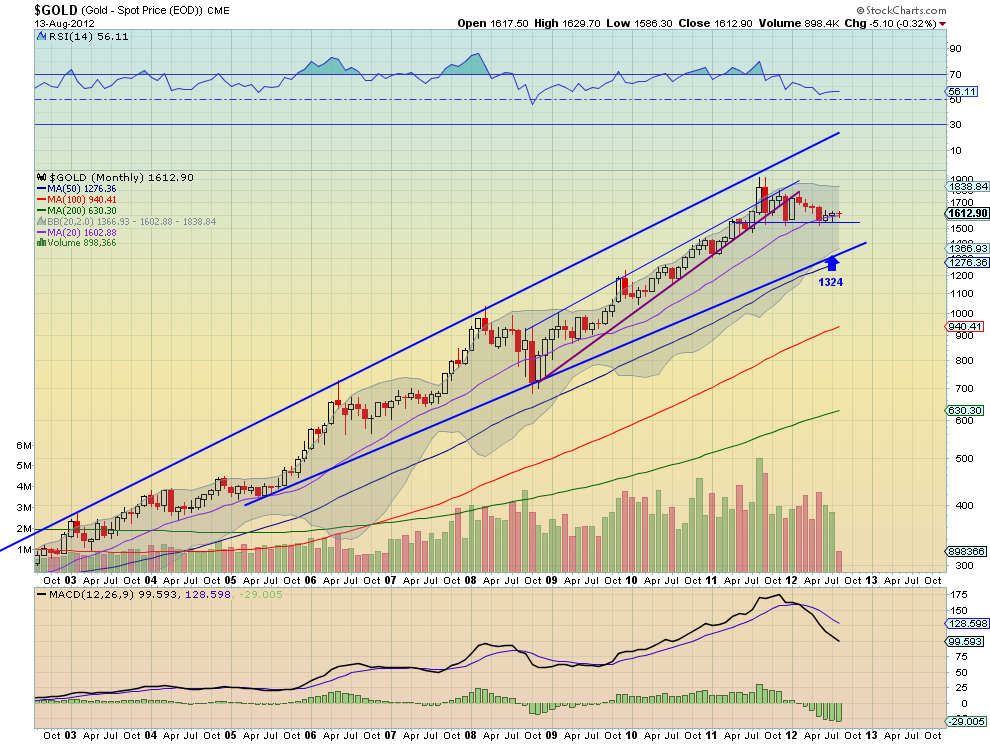
Along with this the 100 week Simple Moving Average (SMA) is rising and acting as support. A bit brighter in this time frame. Another step further out to the monthly chart shows a solid support at 1550. With a rising 50 month SMA pushing it higher but a RSI that is hanging on to the bullish territory and a MACD that is continuing to grow more negative.
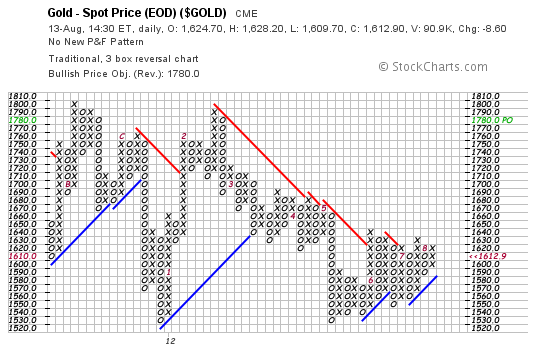
Look out below 1550 on this time frame. The final arbiter, the 3-box reversal Point and Figure Chart, shows a very bullish price objective of 1780. This gives the bias to the long side but it is hard to jump on board until it clears 1640. 
The information in this blog post represents my own opinions and does not contain a recommendation for any particular security or investment. I or my affiliates may hold positions or other interests in securities mentioned in the Blog, please see my Disclaimer page for my full disclaimer.
Original post
- English (UK)
- English (India)
- English (Canada)
- English (Australia)
- English (South Africa)
- English (Philippines)
- English (Nigeria)
- Deutsch
- Español (España)
- Español (México)
- Français
- Italiano
- Nederlands
- Português (Portugal)
- Polski
- Português (Brasil)
- Русский
- Türkçe
- العربية
- Ελληνικά
- Svenska
- Suomi
- עברית
- 日本語
- 한국어
- 简体中文
- 繁體中文
- Bahasa Indonesia
- Bahasa Melayu
- ไทย
- Tiếng Việt
- हिंदी
Gold 4 Ways
Published 08/14/2012, 08:25 AM
Updated 05/14/2017, 06:45 AM
Gold 4 Ways
Latest comments
Loading next article…
Install Our App
Risk Disclosure: Trading in financial instruments and/or cryptocurrencies involves high risks including the risk of losing some, or all, of your investment amount, and may not be suitable for all investors. Prices of cryptocurrencies are extremely volatile and may be affected by external factors such as financial, regulatory or political events. Trading on margin increases the financial risks.
Before deciding to trade in financial instrument or cryptocurrencies you should be fully informed of the risks and costs associated with trading the financial markets, carefully consider your investment objectives, level of experience, and risk appetite, and seek professional advice where needed.
Fusion Media would like to remind you that the data contained in this website is not necessarily real-time nor accurate. The data and prices on the website are not necessarily provided by any market or exchange, but may be provided by market makers, and so prices may not be accurate and may differ from the actual price at any given market, meaning prices are indicative and not appropriate for trading purposes. Fusion Media and any provider of the data contained in this website will not accept liability for any loss or damage as a result of your trading, or your reliance on the information contained within this website.
It is prohibited to use, store, reproduce, display, modify, transmit or distribute the data contained in this website without the explicit prior written permission of Fusion Media and/or the data provider. All intellectual property rights are reserved by the providers and/or the exchange providing the data contained in this website.
Fusion Media may be compensated by the advertisers that appear on the website, based on your interaction with the advertisements or advertisers.
© 2007-2024 - Fusion Media Limited. All Rights Reserved.
