“Gold 2014: It's The New Dawn.”
Such were the words uttered by the iconic Grace Slick in kicking off Jefferson Airplane's sunrise set in singing about revolution at Woodstock in 1969. And ever-so appropriate is that phrase today as we welcome You and Gold to 2014.
Let's start with two observations that perhaps did not make your FinMedia's musings as regards Gold and the S&P 500 opening the new year.
First: With specific respect to Gold, one day does not a new year, nor its entirety make. Still, when trading for 2014 began on Thursday, Gold found itself up better than 49 points from its New Year's Eve low, and indeed at week's end by as many as 58 points in settling at 1237 for its best weekly gain since Halloween. To be sure, we remain firm that "change is an illusion" whereas "price is the truth" and therefore any pricing in the 1200s-to-1500s is still lowly indeed, especially given the Fed's creating Dollars at a pace of better than $3.5 billion per workday. But all great liquid markets generally consolidate price -- as Gold has been doing -- before starting to rise from somewhere, which I have to believe is here.
Second: With specific respect to the S&P 500, in closing out last week's final missive for 2013 we presented some rather stark rationale for a stock market crash. And you know the old Wall Street saw on this one: "as goes opening day, so goes opening week, so goes January and thus so goes the year." On Thursday the S&P saw its initial trading day of the year close down for the first time since -- dare it be said -- 2008, that torrid year eventually having printed a low better than 49% down from 2007's closing level. Fast-forward to 2014 and the S&P has begun with its seventh-worst opening day percentage loss in the last 35 years. I know, -1% seems trivial given the S&P's having risen 28% last year ... but "as goes, so goes"? On verra mes amis.
In any event, through the changing of the calendar year, (albeit with just two of 252 annual trading days now in the books), we clearly see here 'tis Gold that is getting the bid, whilst 'tis the equities of the S&P being rid: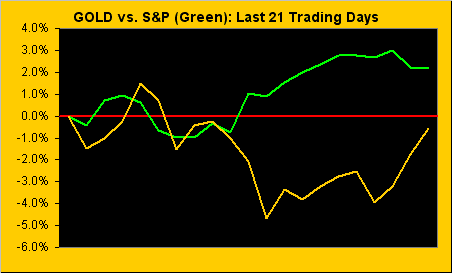
Ah, but then there are those equities unique to the precious metals which make up Gold's so-called "indices brethren" that have been comprehensively beaten beyond submission, indeed back into the very ore of their origin, those once sparkling stocks which make up the Gold Bugs Index (HUI), the Philly Exchange Precious Metals Index (XAU) and the exchange-traded fund of the miners (GDX), all along side the roller-coastin' royalty company Royal Gold (RGLD) and Gold itself. Toward vindicating those who champion the ultimate out-performance back to the upside of these equities over Gold, here we've the year-over-year tracking of the whole bunch. "And the equities are into the far turn..."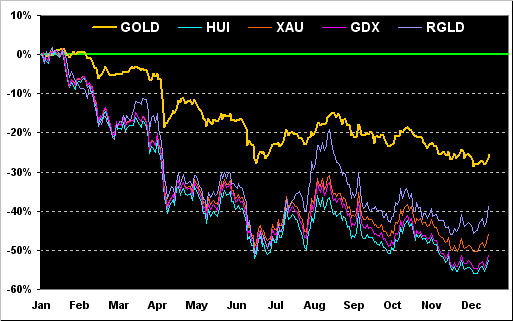
'Course that nice looking up turn doesn't preclude a disappearance of the Gold disbelievers. This past week a colleague forwarded to me a piece on the debilitating pressures of margin squeezes on miners. An appositive from the article reads as follows: "...With the price of gold set to fall further next year..." Quite the blatantly assumptive statement, that. I certainly hope they're Shorting Gold up the wazoo, for as we are wont to say, we need such short-sidedness to take the other side of the trade.
As for the yellow metal's own year-over-year performance, here we've the yearly time frame depicting Gold by its Weekly Bars and the ongoing containment of the parabolic Short trend as its red dots continue to descend. However: throughout this now 13-week run of Short trend, Gold's current price of 1237 is the closest settle yet (55 points) to that level necessary (1292) to flip the dots to Long and blue in the ensuing week. To that perhaps improbable end, 'tis worth noting that Gold's weekly weighted-average trading range is currently running at 52 points, so achieving 1292 ought not be an unreasonable expectation should price be pushed higher for a third consecutive week: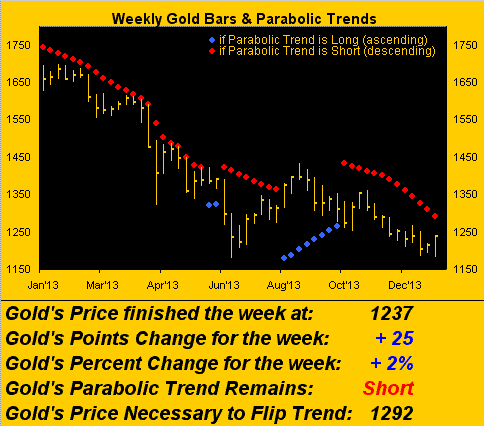
The reality check is, of course, that nothing moves in a straight line. (Yes, Gold did rise for 12 consecutive weeks from mid-August to mid-November in 2007). But I wouldn't panic out there should Gold commence the new week with a bit of a dip, for as we turn to the next three-month graphic of price (thin line) versus magnet (thick line), a natural snap-back thereto may be in order before resuming higher still, and ideally then with the magnet line itself in upside, rather than downside, tow: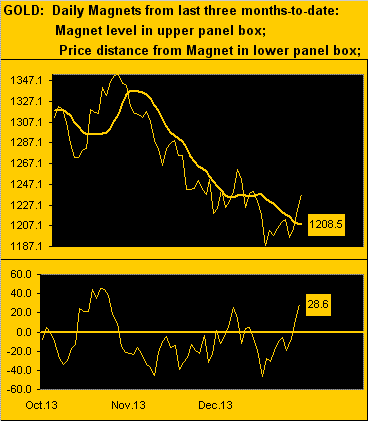
Let's next turn to Gold's trading profile -- its range for the last 10 sessions and horizontal bar lengths representing the contract volume traded per price -- and we see that the picture is very positive. In fact, this the most positively-disposed profile in recent memory. There are support apices in the 1220s, the 12-teens, and then really broad support as you can see across just above 1200 itself, the notion thus being, (admittedly not for this author's first time), the 1100s are el finito: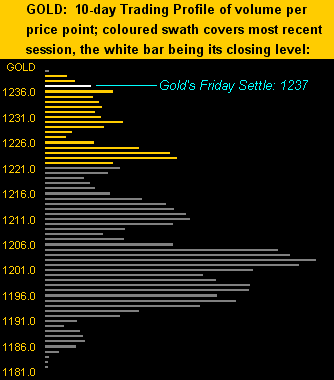
More broadly, we've further fortification that the worst has passed. You may recall from a week ago that Gold's MACD (moving average convergence divergence) study on the daily bars had turned positive, thereby negating what two weeks ago had appeared as an imminent retesting of last year's low (1179). Per this next graphic we see below on the left Gold's bars for the last 21 trading days, the diagonal line of the linear regression trend still in negative slant, but with the baby blue dots resuming their rise, indicative that such downtrend is losing its consistency...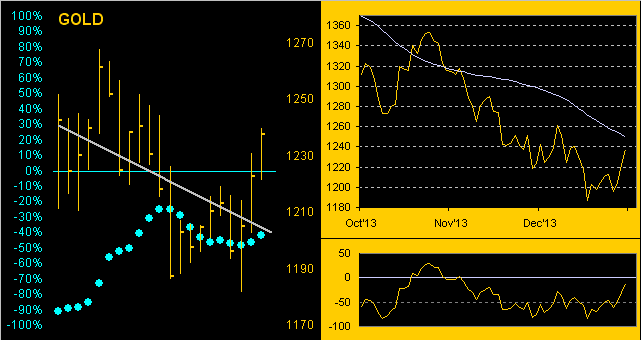
...and above on the right we've Gold racing back up toward its smooth, pearly valuation line, (a regressing of Gold's movements to those of the markets that comprise BEGOS: Bond/Euro/Gold/Oil/S&P). Similar to the magnet line shown earlier, were that valuation line for Gold to resume rising would almost certainly find price traveling back up through the 1300s.
"But mmb, you've no concern that Big Ben said yesterday the economy is strengthening? Isn't that bad for Gold?"
No.
Oh, you're waiting for some elaboration? An economy rising on substantive, real growth is one thing; an economy rising on "bent" data studies, (such as job "creation" being overwhelmingly part-time), and the noted fluffy support of a Fed churning out that aforementioned $3.5 billion per workday is quite another thing. Gold ought be flying under this scenario. And perhaps, 'tis just starting to finally so do, as once again we give due to this aberrative view by which so many have bid their Gold adieu. Aberrative indeed, for broadly across the last 12 years, Gold to me still appears in an uptrend, and certainly so should this consolidation firmly hold and the 300-day moving average soon be regained: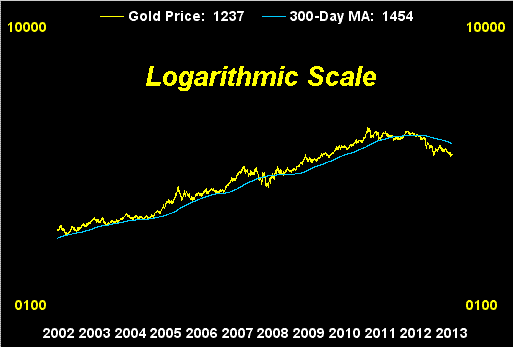
Onto Gold's Structure since its All-Time High and then to the more detailed Gold Stack. Lofty a goal as it may seem, at least returning into The Floor (1579-1750) by mid-year would be a remarkable achievement for 'twould truly mean the sentiment for Gold has whirled 'round: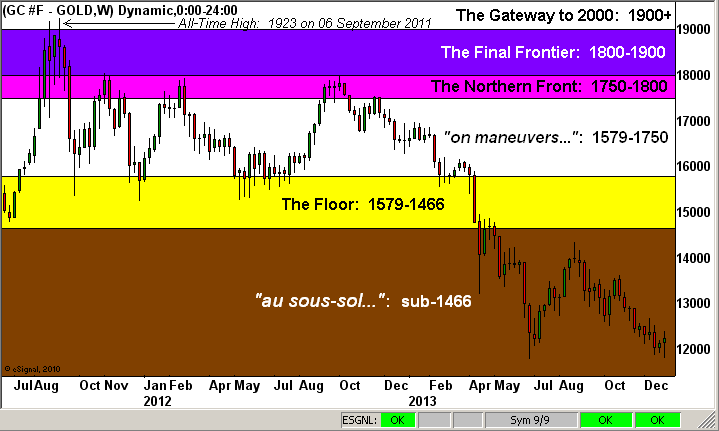
Which brings us to the Gold Stack:
Gold’s All-Time High: 1923 (06 September 2011)
The Gateway to 2000: 1900+
The Final Frontier: 1800-1900
The Northern Front: 1750-1800
On Maneuvers: 1579-1750
The Floor: 1466-1579
Le Sous-sol: Sub-1466
The 300-day Moving Average: 1454
Base Camp:1377
Structural Resistance: 1309 / 1322
The Weekly Parabolic Price to flip Long: 1292
Trading Resistance: (none)
Year-to-Date High: 1240
Gold Currently: 1237, (weighted-average trading range per day: 22 points)
Trading Support: 1236 / 1230 / 1223 / 1211 / 1203 / 1198
Structural Support: 1228 / 1034
10-Session “volume-weighted” average price magnet: 1209, (directional range: 1181 up to 1240 = 59 points or +5%)
Year-to-Date Low: 1203
Finally, just when all (ex-Obamacare) is being reported as simply super both at home and across the pond, 'twas reported this past week that corporate lending in the EuroZone shrank at the fastest pace on record during November, thus "...piling pressure on the European Central Bank to do more to revive the currency bloc's economy...." (i.e. make more €uros -- don't forget: for the first six months of 2010, the Euro fell 12%, yet Gold rose 10%).
- English (UK)
- English (India)
- English (Canada)
- English (Australia)
- English (South Africa)
- English (Philippines)
- English (Nigeria)
- Deutsch
- Español (España)
- Español (México)
- Français
- Italiano
- Nederlands
- Português (Portugal)
- Polski
- Português (Brasil)
- Русский
- Türkçe
- العربية
- Ελληνικά
- Svenska
- Suomi
- עברית
- 日本語
- 한국어
- 简体中文
- 繁體中文
- Bahasa Indonesia
- Bahasa Melayu
- ไทย
- Tiếng Việt
- हिंदी
Gold 2014: A New Dawn?
Published 01/06/2014, 01:22 AM
Updated 07/09/2023, 06:31 AM
Gold 2014: A New Dawn?
3rd party Ad. Not an offer or recommendation by Investing.com. See disclosure here or
remove ads
.
Latest comments
Install Our App
Risk Disclosure: Trading in financial instruments and/or cryptocurrencies involves high risks including the risk of losing some, or all, of your investment amount, and may not be suitable for all investors. Prices of cryptocurrencies are extremely volatile and may be affected by external factors such as financial, regulatory or political events. Trading on margin increases the financial risks.
Before deciding to trade in financial instrument or cryptocurrencies you should be fully informed of the risks and costs associated with trading the financial markets, carefully consider your investment objectives, level of experience, and risk appetite, and seek professional advice where needed.
Fusion Media would like to remind you that the data contained in this website is not necessarily real-time nor accurate. The data and prices on the website are not necessarily provided by any market or exchange, but may be provided by market makers, and so prices may not be accurate and may differ from the actual price at any given market, meaning prices are indicative and not appropriate for trading purposes. Fusion Media and any provider of the data contained in this website will not accept liability for any loss or damage as a result of your trading, or your reliance on the information contained within this website.
It is prohibited to use, store, reproduce, display, modify, transmit or distribute the data contained in this website without the explicit prior written permission of Fusion Media and/or the data provider. All intellectual property rights are reserved by the providers and/or the exchange providing the data contained in this website.
Fusion Media may be compensated by the advertisers that appear on the website, based on your interaction with the advertisements or advertisers.
© 2007-2024 - Fusion Media Limited. All Rights Reserved.