Oracle stock jumps 5% on TikTok deal progress, OpenAI fundraise talks

The risk budget this month is unchanged. For the moderate risk investor, the allocation between risk assets and bonds remains at a defensive 40/60 versus the benchmark of 60/40.
Credit spreads narrowed on the month, but the widening trend is intact and has recently resumed.
Valuations are still excessive and 3rd quarter earnings have been generally downbeat. A divergence is opening between operating and reported earnings, a phenomenon we’ve seen in the past near the end of a business cycle.
Long term momentum is still negative. The selloff this week has turned short term momentum negative as well.
The yield curve remains in the middle of its historic range offering little guidance.
Inflation expectations are trying to stabilize but the trend is still down.

Credit Spreads
Credit spreads improved over the last month, but the trend is still toward wider spreads. In just the last week, spreads have started to widen again and stocks have responded negatively. We are already at a reduced equity allocation and to get even more defensive at this point would require a further deterioration in spreads. If the ML HY Master II OAS exceeds 7.5%, I will likely further reduce the equity allocation to roughly 50% of normal.

Baa spreads also improved somewhat over the last month but remain at levels higher than the onset of previous recessions.

Yield Curve
The yield curve still isn’t providing much in the way of useful information, sitting in the middle of its historical range:

With little change in inflation expectations, the entire curve shifted higher based on what I can only surmise is supreme confidence in the Fed’s view that growth is accelerating. It would be nice if we had something other than one outlier employment report to support that view.

Valuations
With the market within spitting distance of its all time highs and earnings down for the last several quarters – this will be three quarters in a row of falling reported earnings year over year or two if you want to believe “operating earnings” or as I like to call them, earnings before all the bad stuff – valuations have not improved. There are places around the world that are cheap – mostly in the emerging world – but they are isolated and cheap for good reasons. Corporate and junk bonds are a bit more attractive after the spread widening but it doesn’t look as if the widening trend is done just yet. I suppose if one wanted to act very contrarian in a cheap part of the market, commodity stocks might be an option but catching falling knives is not for the faint of heart or anyone who can’t take a quick loss. Certainly in the oil patch, inventory would seem to indicate that the glut is far from over. Bottom line is that there isn’t much cheap in the world.
Momentum
Say what you will about the technicals of the stock market, but to me this is looking more and more like the gentlemen’s exit, a last chance to get out near the highs. That term – gentlemen’s exit – is one that my friend Eric Hull came up with to describe the rebound we always seem to see after the initial sell off. If this is the last chance exit for this bull market it will have come quicker than one’s in past tops but then everything seems to be quicker these days.
Momentum had shifted on the daily chart to a buy at the end of September but the rally has run out of steam:

The long term picture still looks to be an ongoing topping process:

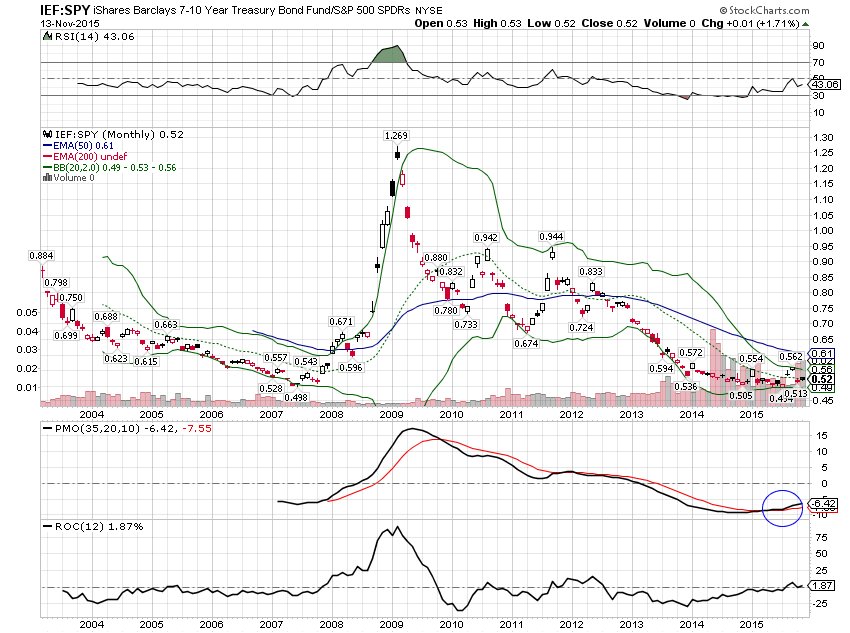
And despite the big selloff in bonds and the short term stock rally, momentum is still shifting to bonds and away from stocks:
US stocks do look vulnerable but they are still outperforming their foreign counterparts, at least in the form of the broad based EAFE (N:EFA) index. I’ve been overweight EAFE vs US based on valuation but if this doesn’t turn soon I’m going to have to reconsider.

Part of the reason for that is the action in the dollar. As I said last month, the long term momentum for the dollar still points higher and the between Draghi hinting at more Euro QE and a Fed that discovered its inner hawk, the index moved higher on the month. It is now running into some resistance though and everybody and his brother is long so we’ll see how this plays out.

The strong dollar also means there is little reason to own general commodities although we still maintain a small position in gold.

Our moderate risk allocation has not changed for the month:

Momentum Asset Allocation
I also run two asset allocation models (one aggressive, one more moderate) based on momentum. These models ignore all fundamental and economic information in favor of just allocating to the asset classes that are exhibiting momentum. Here’s where those models stand as of today (rebalancing is monthly):
Aggressive Version:
50% SPY
50% N:IYR
Moderate Version:
100% Cash
The aggressive version of this allocation method does not incorporate the risk control parameters of the more moderate version and that means that despite our views on the stock market, SPY gets an allocation this month. Of the assets in that version of this allocation method – the two versions don’t have the exact same assets to choose from – SPY was the best performing asset available. The moderate version uses a risk control method that prevents purchasing any ETF that is trading below its 125 day moving average. This month that meant an allocation to all cash.
“Wealth preservation and accumulation through thoughtful investing.”
For information on Alhambra Investment Partners’ money management services and global portfolio approach to capital
This material has been distributed for informational purposes only. It is the opinion of the author and should not be considered as investment advice or a recommendation of any particular security, strategy, or investment product. Investments involve risk and you can lose money. Past investing and economic performance is not indicative of future performance. Alhambra Investment Partners, LLC expressly disclaims all liability in respect to actions taken based on all of the information in this writing. If an investor does not understand the risks associated with certain securities, he/she should seek the advice of an independent adviser.