GBP/USD - Today's Technical Report/Commentary:
The Pound started the week with a 150-pip gap to the downside to open at a 10-month low of 1.6181, before recording another 10-month low earlier today at 1.6050, which is only 8 pips below yesterday's low. The reason behind this gap as reported, is fresh Scottish polls supporting leaving the UK. If this actually happens, it will only be logical for the Pound to lose more and more value, and add to the 6.6% loss in value seen since July!
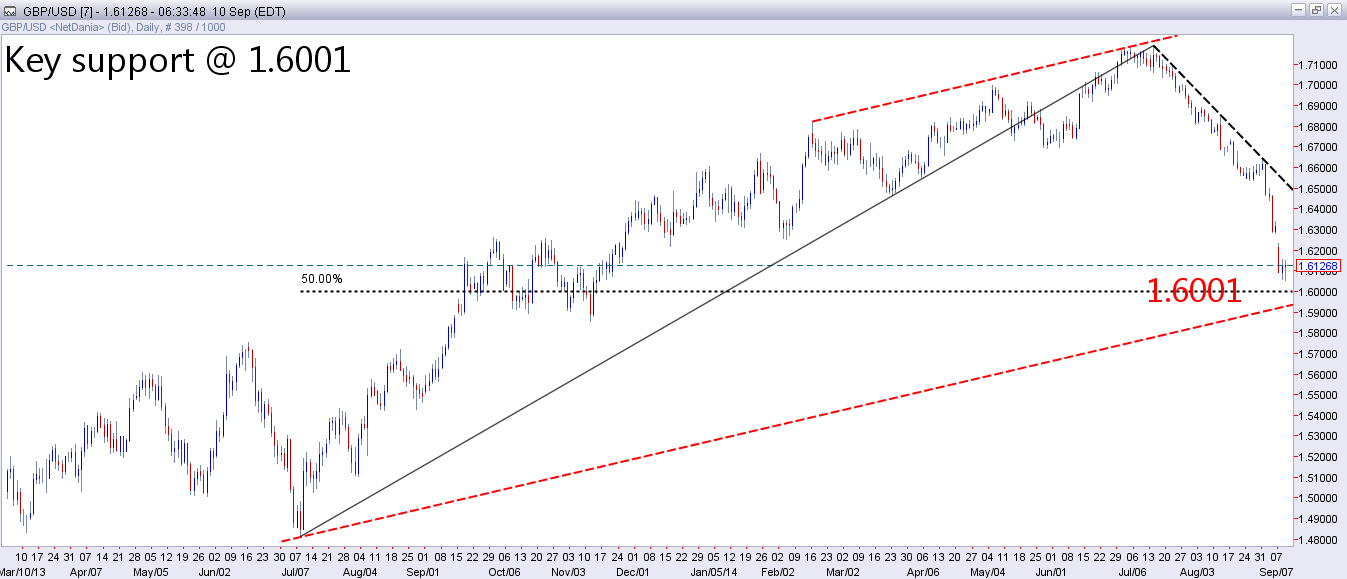
Technically, breaking below Friday’s low 1.6281 was an obvious sign of weakness because this level was one pip below the long Term Fibonacci 38.2% retracement. The next big level is the 50% retracements, which is at 1.6001. If we draw a trend line using February’s top and July’s 6-year high, then draw a parallel line to it, and place it at July’s 2013 major bottom 1.4812, this line would run just a little below 1.6001, adding to its importance. This is probably the most important short term and medium term support for the time being. There is no reason preventing the price from falling below today’s current daily low 1.6050, but the bears need to break below 1.6001 in order to continue moving south.
If this break actually happens, the medium term outlook will be seriously hit. Targets for such a break include 1.5832 as the minimum target, followed by 2 more important levels at 1.5720 and 1.5492! Closer and shorter term support levels can be found in the support section below.
On the resistance side of the story, we first turn to the micro term retracements, but we will calculate them for the falling move from Friday's American session high 1.6337. This calculation produces levels at 1.6160, 1.6194, 1.6227 and 1.6255. A break above the first is a first sign of strength, but if it is followed by other breaks above the rest of the levels, that would be better. If 1.6255 gives way, then a recovery to “close the window” could follow. The Japanese call the gap a “window”, and they refer to the moves that cover the gaps as move that close this window. A break above 1.6160 could be the first real step towards this happening.
Above 1.6255, we will be targeting 1.6276 at least, followed by 1.6346 which sure looks more attractive since it is above Friday’s close, which means that reaching this target will "close the window".
Chart:

Support:
• 1.6050: today's current daily low.
• 1.6001: long term Fibonacci 50% calculated for whole enormous move from 2013 yearly low 1.4812 to July’s 6-year high 1.7190.
• 1.5954: September 23rd 2013 daily low and short term bottom.
• 1.5902/21: a well-known support area which includes several daily lows from October and November 2013.
• 1.5832: long term Marji 57.1% calculated for whole enormous move from 2013 yearly low 1.4812 to July’s 6-year high 1.7190.
• 1.5720: long term Fibonacci 50% calculated for whole enormous move from 2013 yearly low 1.4812 to July’s 6-year high 1.7190.
• 1.5492: long term Marji 71.4% calculated for whole enormous move from 2013 yearly low 1.4812 to July’s 6-year high 1.7190.
Resistance:
• 1.6160: micro term Fibonacci 38.2% calculated for the move from Friday’s American session’s high 1.6337 to today’s current daily low 1.6050.
• 1.6194: micro term Fibonacci 50% calculated for the move from Friday’s American session’s high 1.6337 to today’s current daily low 1.6050.
• 1.6227: micro term Fibonacci 61.8% calculated for the move from Friday’s American session’s high 1.6337 to today’s current daily low 1.6050.
• 1.6255: micro term Marji 71.4% calculated for the move from Friday’s American session’s high 1.6337 to today’s current daily low 1.6050. This is the first important level for the short term.
• 1.6276: short term Fibonacci 38.2% retracement level, calculated for the drop from September 1st daily high 1.6642 to today’s current daily low 1.6050.
• 1.6327: Friday’s close, the beginning point of the gap.
• 1.6346: short term Fibonacci 50% retracement level, calculated for the drop from September 1st daily high 1.6642 to today’s current daily low 1.6050.
• 1.6388: short term Marji 57.1% retracement level, calculated for the drop from September 1st daily high 1.6642 to today’s current daily low 1.6050.
• 1.6416: short term Fibonacci 61.8% retracement level, calculated for the drop from September 1st daily high 1.6642 to today’s current daily low 1.6050.
• 1.6473: short term Marji 71.4% retracement level, calculated for the drop from September 1st daily high 1.6642 to today’s current daily low 1.6050.
Trend:
• Short term: Down, as long as we are below 1.6183.
• Medium term: Down, as long as we are below 1.6476.
• Long term: Up, as long as we are above 1.5492.
Article originally appeared on MarjiFX.com
