Once we broke 1.6185, Cable was off and flying and overnight we have seen 1.6258. Now this is slightly below the 1st Oct Highs and there could well be a Double Top in place now on the daily charts. We will only know if the market fails to make a break above 1.6285. Then we have a clear indication that correction is going to take place.
We are already lower this morning and there is a chance of this coming back and testing the trendline which comes in at 1.6146. Now obviously we have to negotiate our way past 1.6199 which is the daily pivot and the break point of 1.6185 but if we can do that there is a good chance of further correction. Already the 60 min charts are showing there to be a bit of a corrective phase. Now the daily charts remain positive, so we have to be aware of this and we still therefore buy into weakness. 1.6146 trendline support should offer this entry point and we would hold longs unless we see a break below 1.6130.
Now as stated we have good resistance from the previous 1.6262 high then we have 1.6285 and if above here it would negate the D/T formation and leave the yearly 1.6323 high exposed - here cover all longs.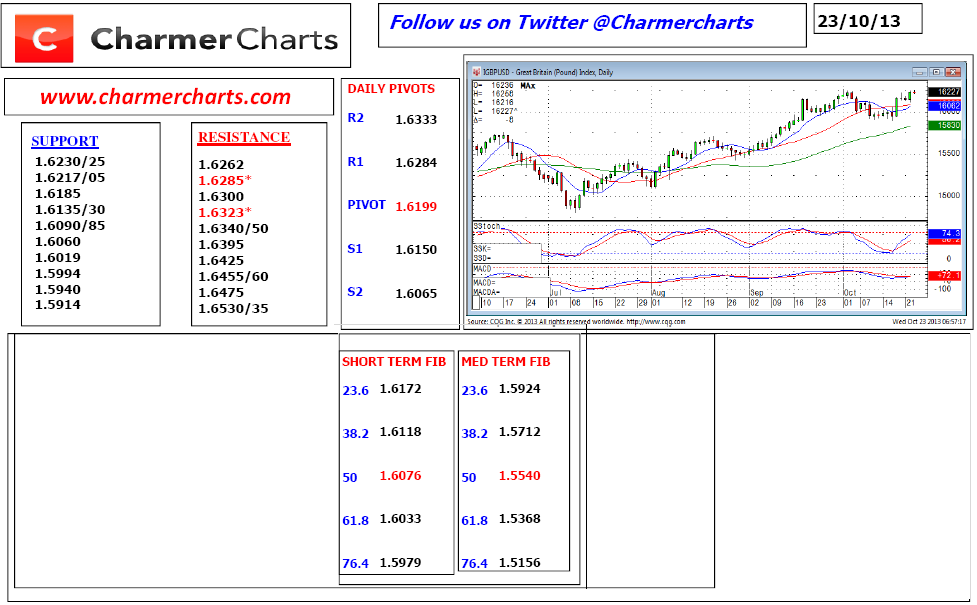 GBP/USD" title="GBP/USD" height="605" width="977">
- English (UK)
- English (India)
- English (Canada)
- English (Australia)
- English (South Africa)
- English (Philippines)
- English (Nigeria)
- Deutsch
- Español (España)
- Español (México)
- Français
- Italiano
- Nederlands
- Português (Portugal)
- Polski
- Português (Brasil)
- Русский
- Türkçe
- العربية
- Ελληνικά
- Svenska
- Suomi
- עברית
- 日本語
- 한국어
- 简体中文
- 繁體中文
- Bahasa Indonesia
- Bahasa Melayu
- ไทย
- Tiếng Việt
- हिंदी
GBP/USD: Cable Is Flying
Published 10/23/2013, 01:58 AM
Updated 07/09/2023, 06:32 AM
GBP/USD: Cable Is Flying
Latest comments
Install Our App
Risk Disclosure: Trading in financial instruments and/or cryptocurrencies involves high risks including the risk of losing some, or all, of your investment amount, and may not be suitable for all investors. Prices of cryptocurrencies are extremely volatile and may be affected by external factors such as financial, regulatory or political events. Trading on margin increases the financial risks.
Before deciding to trade in financial instrument or cryptocurrencies you should be fully informed of the risks and costs associated with trading the financial markets, carefully consider your investment objectives, level of experience, and risk appetite, and seek professional advice where needed.
Fusion Media would like to remind you that the data contained in this website is not necessarily real-time nor accurate. The data and prices on the website are not necessarily provided by any market or exchange, but may be provided by market makers, and so prices may not be accurate and may differ from the actual price at any given market, meaning prices are indicative and not appropriate for trading purposes. Fusion Media and any provider of the data contained in this website will not accept liability for any loss or damage as a result of your trading, or your reliance on the information contained within this website.
It is prohibited to use, store, reproduce, display, modify, transmit or distribute the data contained in this website without the explicit prior written permission of Fusion Media and/or the data provider. All intellectual property rights are reserved by the providers and/or the exchange providing the data contained in this website.
Fusion Media may be compensated by the advertisers that appear on the website, based on your interaction with the advertisements or advertisers.
© 2007-2024 - Fusion Media Limited. All Rights Reserved.