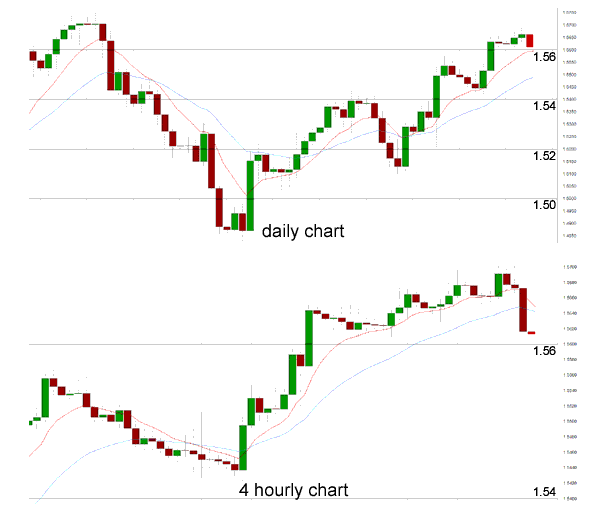
The GBP/USD has done well throughout this week to maintain its level above the key 1.56 level and in the process has moved to a new two month high above 1.57 in the last 24 hours. It has since retreated strongly but is continuing to receive solid support from the 1.56 level. It reversed well to finish out last week to surge higher through the resistance level at 1.56 to a then two month high around 1.5650. It has now spent the last few days since consolidating and trading within a narrow range around 1.5650 as it is now starting to receive some support from the key 1.56 level. It retraced back back to the 1.5450 level, after having spent the week prior moving higher and breaking through the resistance level at 1.54 pushing towards further resistance near 1.56. The resistance level at 1.54 was proving to be quite solid, and once it broke through the pound surged higher to a new seven week high near 1.56 in a solid 48 hour period run. In the week leading up to this the pound had recovered strongly and returned to the previous resistance level at 1.54 after the week earlier undoing some of its good work and falling away sharply from the resistance level at 1.54 back down to around 1.5150 and a two week low. A few weeks ago the 1.54 resistance level stood firm and the pound fell away heavily, however the 1.51 support level proved decisive and helped the pound rally strongly.
Earlier in July after having done very little for about a week, the GBP/USD started to move and surge higher and move through the 1.52 and 1.53 levels to the one month high above 1.54. Prior to the move higher, it moved very little as it found solid support at 1.51 and traded within a narrow range above this level. It established a trading range in between 1.51 and 1.52 after it took a breather from its excitement just prior when it experienced a strong surge higher moving back to within reach of the 1.52 level from below 1.49, all in 24 hours. About a month ago it did well to climb off the canvas and move back above 1.49 and towards 1.50 again before seeing the pound reverse and head back down below 1.49 to reach a new multi-year low near 1.48. It experienced sharp falls moving from 1.53 down to the key long term level of 1.50 and then through 1.49. That movement saw it resume its already well established medium term down trend from the second half of June and move it to a four month low.
Throughout the first half of June, it enjoyed its best run in a long time as it surged from 1.50 to 1.57 in just a few weeks. Its multiple key levels during its movement up towards 1.57 have appeared to have little impact during its decline in the month afterwards. With its recent surge higher it has nearly regained all of its losses from June and July when it fell strongly from 1.5750 down to below 1.49. Throughout the month of May the pound fell strongly and return almost all of its gains from the few weeks before that. In early March the pound moved to new lows around 1.4830 from a starting point near 1.64 at the beginning of the year.
The Treasury ran up a rare July deficit last month, raising doubts about the coalition’s progress in tackling the black hole in Britain’s public finances. July traditionally sees a surplus as it is a strong month for tax receipts, with quarterly corporation tax payments due. But the Office for National Statistics said the government had to borrow £100m last month, compared with the £800m surplus it ran up in the same month last year.Once the boost from banking the proceeds of the government’s quantitative easing programme were excluded, the deficit increased to £500m.Taking the first four months of the financial year together, the underlying picture was of a £36.8bn shortfall, up from £35.2bn over the same period in 2012-13. That was an increase of 4.7% – a larger rise than the independent Office for Budget Responsibility (OBR) is expecting for the fiscal year as a whole. 
GBP/USD August 22 at 01:45 GMT 1.5617 H: 1.5717 L: 1.5604
During the early hours of the Asian trading session on Thursday, the GBP/USD is continuing to fall heavily back towards 1.56 after running into resistance around 1.57. Since the middle of June the pound has fallen very strongly from the resistance level at 1.57 back down towards the long term key level at 1.50 and is now enjoying a solid recovery over the last month or so. Current range: Right around 1.5620.
Further levels in both directions:
• Below: 1.5600, 1.5450 and 1.5200.
• Above: 1.5700.
(Shows the ratio of long vs. short positions held for the GBP/USD among all OANDA clients. The left percentage (blue) shows long positions; the right percentage (orange) shows short positions.)
The GBP/USD long positions ratio has moved well below 30% as the GBP/USD has pushed up through 1.56 over the last few of days. Trader sentiment remains in favour of short positions.
Economic Releases
- 07:58 EU Flash Composite PMI (Aug)
- 07:58 EU Flash Manufacturing PMI (Aug)
- 07:58 EU Flash Services PMI (Aug)
- 12:30 CA Retail Sales (Jun)
- 12:30 US Initial Claims (16/08/2013)
- 12:58 US Flash Manufacturing PMI (Aug)
- 13:00 US FHFA House Price Index (Jun)
- 14:00 US Leading Indicator (Jul)