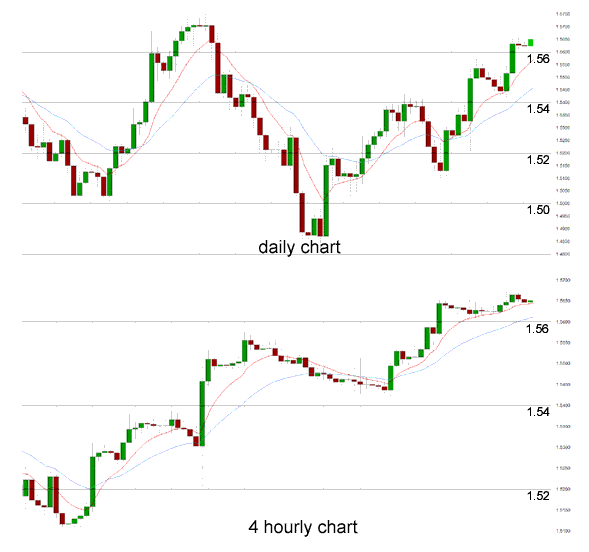
The GBP/USD reversed well to finish out last week, surging higher through the resistance level at 1.56 to a new two month high around 1.5650. It has now spent the last few days since consolidating and trading within a narrow range around 1.5650 as it is now starting to receive some support from the key 1.56 level. It retraced back to the 1.5450 level, after having spent the week prior moving higher and breaking through the resistance level at 1.54, pushing towards further resistance near 1.56.
The resistance level at 1.54 was proving to be quite solid, and once it broke through, the pound surged higher to a new seven week high, near 1.56 in a solid 48 hour period run. During the week leading up to this, the pound had recovered strongly and returned to the previous resistance level at 1.54 after the week earlier undoing some of its good work and falling away sharply from the resistance level at 1.54 back down to around 1.5150--a two week low. A few weeks ago the 1.54 resistance level stood firm and the pound fell away heavily, however the 1.51 support level proved decisive and helped the pound rally strongly.
Earlier in July after having done very little for about a week, the GBP/USD started to move and surge higher, moving through the 1.52 and 1.53 levels to the one month high above 1.54. Prior to the move higher, it moved very little as it found solid support at 1.51 and traded within a narrow range above this level. It established a trading range between 1.51 and 1.52 after it took a breather from its excitement just prior, when it experienced a strong surge higher moving back to within reach of the 1.52 level from below 1.49, all in 24 hours.
The U.K. housing market revival continued in August despite the first dip in sellers’ asking prices this year, a property website has reported. Asking prices edged down by 1.8% month-on-month to £249,199 on average – but a string of price increases over the last seven months means they are still £20,000 higher than at the start of 2013, Rightmove said. In further signs of the market gathering pace, asking prices on flats reached a record high at £209,652. Flats are in strong demand due to high numbers of buy-to-let investors looking for decent returns and a recent surge in first-time buyers, who are finding it easier to access a mortgage, entering the market. Asking prices on flats are up 5.9% year-on-year, indicating that first-time buyers, who traditionally buy this type of property, will potentially have to stretch themselves further to get on the housing ladder.
GBP/USD August 20 at 01:05 GMT 1.5647 H: 1.5673 L: 1.5609
During the early hours of the Asian trading session on Tuesday, the GBP/USD is consolidating right around 1.5650 after having just eased back 1.5670 in the last 12 hours or so. Since the middle of June the pound has fallen very strongly from the resistance level at 1.57 back down towards the long term key level at 1.50 and is now enjoying a solid recovery over the last month or so. Current range: Right around 1.5650.
Further levels in both directions:
• Below: 1.5450 and 1.5200.
• Above: 1.5650.
(Shows the ratio of long vs. short positions held for the GBP/USD among all OANDA clients. The left percentage (blue) shows long positions; the right percentage (orange) shows short positions.)
The GBP/USD long positions ratio has moved well below 40% as the GBP/USD has pushed up through 1.56 over the last few of days. Trader sentiment remains in favour of short positions.
Economic Releases
- 01:30 AU RBA Monetary Policy Meeting
- 03:00 NZ RBNZ Inflation Expectations (Q3)
- 04:30 JP All Industry activity index (Jun)
- 10:00 UK CBI Industrial Trends (20th-25th) (Aug)
- 12:30 CA Wholesale Sales (Jun)