Focus Media Holding Limited (FMCN) is a multi-platform digital media company, operating liquid crystal display (LCD) display network in the People’s Republic of China using audiovisual digital displays in commercial and residential locations.
This is a depressed vol note on a Chinese stock that has gapped several times this year and has demonstrated both substantial firm specific and systematic (China) risk, yet... I found FMCN using a real-time custom scan that hunts for low vols.
Custom Scan Details
Stock Price GTE $10
IV30™ GTE 30
IV30™ Percentile LTE 10
IV30™ - HV180™ LTE -7
Average Option Volume GTE 1,200
The goal with this scan is to identify short-term implied vol (IV30™) that is depressed to the long-term stock movement (HV180™) was well as its own history. I'm also looking for a reasonable amount of liquidity in the options (thus the minimum average option volume) and minimum level of vol so the examination is more interesting.
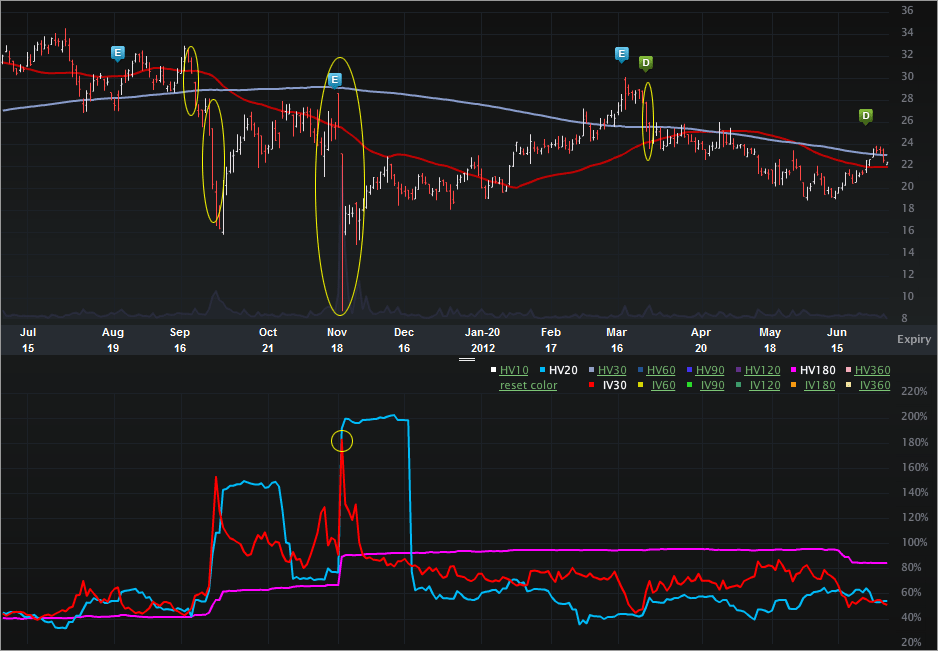
The FMCN Charts Tab is included for the last year, below. The top portion is the stock price, the bottom is the vol (IV30™ - red vs HV20™ - blue vs HV180™ - pink).
On the stock side, I've highlighted several large stock moves. I've included a table (below) that summarizes the stock moves and some of the news surrounding them.
1. 9-22-2011: Stock down 9.6% from $30.43 to $27.52.
2. 9-28-2011: to 9-30-2012: Stock down 32.3% from $24.88 to $16.84.
Systematic Risk
What: Some days, it just doesn't pay to be associated with China. Thursday, investors in industries as far afield as luxury retailing, including Coach (NYSE: COH) and Tiffany (NYSE: TIF) , saw their stocks crushed. The culprit: worries that China's rising middle class might take a tighter grip on their wallets as manufacturing growth stagnates. Meanwhile, stocks tied more directly into the Chinese economy suffered even worse. Take advertising powerhouse Focus Media (Nasdaq: FMCN) -- down more than 18% in the day's trading.
So what: If worries about a contracting Chinese manufacturing sector hurt Coach and Tiffany, they'd logically hurt the kinds of firms that advertise their products, too. Focus Media is one such company, and it appears to have become a favorite of short sellers betting against the company. According to one source, options trading against the stock Thursday was more than 10 times its usual daily average. -- Source: The Motley Fool via Yahoo! Finance; Focus Media Got Crushed: What You Need to Know, written by Rich Smith.
3. 11-21-2012: Stock down 39.5% from $25.50 to $15.43.
Firm Specific Risk
Focus Media halted after plunging 62% following Muddy Waters report (9.57 -15.92) -Update
Source: Provided by Briefing.com (www.briefing.com)
4. 3-27-2012 to 3-29-2012: Stock down 13.2% from $27.78 to $24.10
The basic takeaway here is that FMCN can gap and has gapped frequently -- usually to the downside and not necessarily due to an earnings report. The stock seems to have particularly high systematic risk (with China) and certainly has a non-trivial amount of firm specific risk (see reaction to Muddy Waters' report). Yet, we see low vol...
On the vol side, we can see a few things:
1. Today, the vol is depressed in triplicate to its own history, the long-term historical realized vol and the short-term historical realized vol. The 52 wk range in IV30™ for FMCN is [39.27%, 182.95%], putting the current level in just the 8th percentile. The vol comps at present are:
IV30™: 51.62%
HV20™: 54.23%
HV180™: 84.65%
2. The implied has been much higher and can spike on big moves.
3. When the stock gaps, the implied tends to track the HV20™ -- kinda the same thing as #2, but in English, when news comes out, it rarely lowers vol (which would be normal), but rather expands vol.
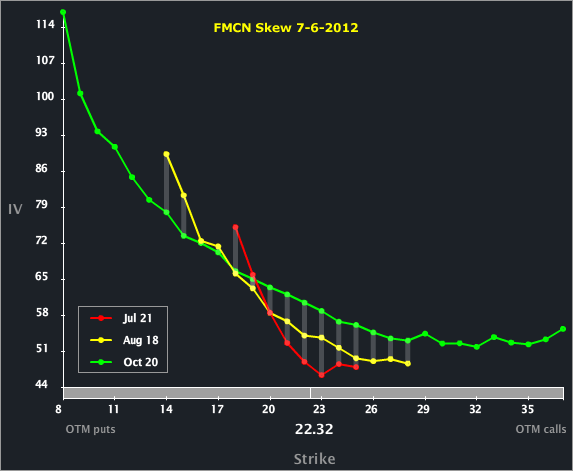
Let's turn to the Skew Tab to examine the line-by-line and month-to-month vols.
We can see that the skew shapes are pretty normal, even pretty. We can also see that the ATM vols monotonically increase from the front to the back. The next earnings release should be after Aug expiry, so Oct should be elevated to the front two months. In English, while the vol levels right now are quite compelling, the skew in and of itself is kinda blah.
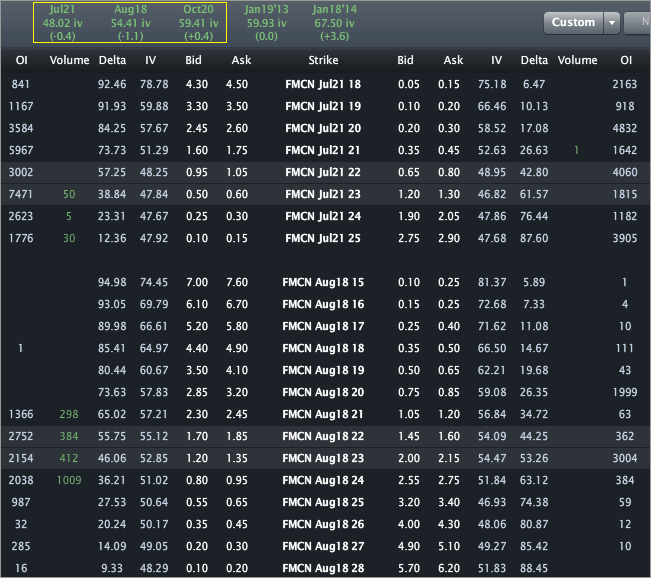
Finally, let's look to the Options Tab (below).
Across the top we can see the vols by expiry are 48.02%, 54.41% and 59.41% for Jul, Aug and Oct, respectively. Given the annual range in IV30™, the propensity for FMCN to gap and more holistically the risk tied into China via the EuroZone (and it's own "stuff"), this was one name that I certainly did not expect to see showing up on a depressed vol scan.
Disclosure: This is trade analysis, not a recommendation.
- English (UK)
- English (India)
- English (Canada)
- English (Australia)
- English (South Africa)
- English (Philippines)
- English (Nigeria)
- Deutsch
- Español (España)
- Español (México)
- Français
- Italiano
- Nederlands
- Português (Portugal)
- Polski
- Português (Brasil)
- Русский
- Türkçe
- العربية
- Ελληνικά
- Svenska
- Suomi
- עברית
- 日本語
- 한국어
- 简体中文
- 繁體中文
- Bahasa Indonesia
- Bahasa Melayu
- ไทย
- Tiếng Việt
- हिंदी
Gapping Focus Media Stock With Multi-Layered Risk Shows Depressed Vol
Published 07/08/2012, 03:27 AM
Updated 07/09/2023, 06:31 AM
Gapping Focus Media Stock With Multi-Layered Risk Shows Depressed Vol
Latest comments
Loading next article…
Install Our App
Risk Disclosure: Trading in financial instruments and/or cryptocurrencies involves high risks including the risk of losing some, or all, of your investment amount, and may not be suitable for all investors. Prices of cryptocurrencies are extremely volatile and may be affected by external factors such as financial, regulatory or political events. Trading on margin increases the financial risks.
Before deciding to trade in financial instrument or cryptocurrencies you should be fully informed of the risks and costs associated with trading the financial markets, carefully consider your investment objectives, level of experience, and risk appetite, and seek professional advice where needed.
Fusion Media would like to remind you that the data contained in this website is not necessarily real-time nor accurate. The data and prices on the website are not necessarily provided by any market or exchange, but may be provided by market makers, and so prices may not be accurate and may differ from the actual price at any given market, meaning prices are indicative and not appropriate for trading purposes. Fusion Media and any provider of the data contained in this website will not accept liability for any loss or damage as a result of your trading, or your reliance on the information contained within this website.
It is prohibited to use, store, reproduce, display, modify, transmit or distribute the data contained in this website without the explicit prior written permission of Fusion Media and/or the data provider. All intellectual property rights are reserved by the providers and/or the exchange providing the data contained in this website.
Fusion Media may be compensated by the advertisers that appear on the website, based on your interaction with the advertisements or advertisers.
© 2007-2024 - Fusion Media Limited. All Rights Reserved.
