
GameStop Corp. (NYSE:GME) posted first-quarter fiscal 2019 results, wherein the bottom line beat the Zacks Consensus Estimate while sales lagged. However, both metrics declined year over year. In fact, this Zacks Rank #3 (Hold) stock has tumbled almost 32.4% in the past three months compared with the industry’s decline of 7.5%.

Q1 Performance
In the quarter under review, adjusted earnings per share fell more than four folds year over year to 7 cents but surpassed the Zacks Consensus Estimate of a loss of 2 cents.
Net sales declined 13.3% (down 11.5% on a currency-neutral basis) year over year to $1,547.7 million. Moreover, the top line missed the Zacks Consensus Estimate of $1,665 million.
Consolidated comparable store sales (comps) slumped 10.3%. The decline can be attributed to a 10.2% and 10.4% decrease in the United States and international areas, respectively.
By sales mix, new video game hardware sales declined 35% to $233.5 million. Higher sales of switch console were negated by overall decline in hardware sales across the remaining platforms.
New video game software sales fell 4.3% to $446.4 million, thanks to sluggishness in new title launches and higher digital adoption. Pre-owned and value video game products’ sales were $395.3 million, down 20.3% year over year due to falling demand for physical video games and rising digital content. Also, digital receipts tumbled 6.7% to $255.4 million and digital sales fell 11.4% to $38.1 million owing to a decline in game downloads.
Nevertheless, video game accessories sales inched up 0.6% to $200.2 million, backed by strong headset and controller sales. Collectibles’ sales rose 10.5% to $157.3 million in the reported quarter.
Moving on, gross profit fell 11.3% from year-ago quarter to $471.2 million. Moreover, gross margin expanded 70 basis points (bps) to 30.4%, stemming from shift from hardware to software collectibles and digital.
SG&A expenses dipped almost 5.6% to $430.6 million in the reported quarter. Adjusted operating income declined approximately 62.4% to $17.5 million and adjusted operating margin contracted nearly 150 bps to 1.1%.
Other Financial Aspects
GameStop ended the quarter with cash and cash equivalents of $543.2 million, up nearly $301.1 million year on year. Also, the company had net receivables of $126 million, net long-term debt of $468.9 million and shareholders’ equity of $1,291.7 million at quarter end.
On Jun 3, 2019, management declared the elimination of quarterly dividend in a bid to improve its balance sheet. This move will be effective immediately from the said time period and is expected to save $157 million in cash annually.
Store Update
As of May 4, 2019, the company operated 3,777 video game stores in the United States; 1,912 international stores, 41 domestic collectible stores and 60 international collectible stores.
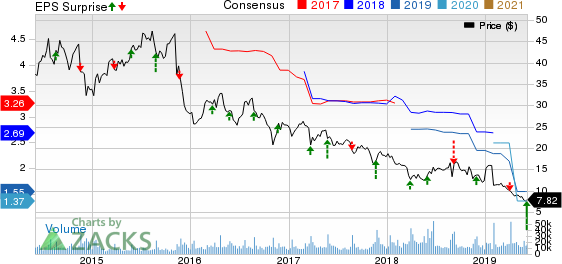
GameStop Corp. Price, Consensus and EPS Surprise
Guidance
During the reported quarter, the company undertook cost-savings and operating profit improvement initiatives announced in April 2019. This strategy aims at strengthening the organization and aid financial improvement and profitability in the long term. In the first quarter, its efforts in this regard include supply chain initiatives, operational enhancements, cost savings, pricing and promotion optimization. Further, the company expects to achieve annualized operating profit growth of around $100 million on the back of the program. Also, management expects this initiative to have a positive impact on margins.
Since the savings initiative is on track, the company has not provided any earnings projection for fiscal 2019. However, it has retained its view for sales and comps and still expects the said metrics to decline in the range of 5-10%, respectively, for fiscal 2019. Also, management continues to anticipate adjusted income tax rate of nearly 27%.
Three Better-Ranked Retail Stocks You May Count on
Children’s Place (NASDAQ:PLCE) , with long-term earnings per share growth rate of 8%, carries a Zacks Rank #1 (Strong Buy). You can see the complete list of today’s Zacks #1 Rank stocks here.
Xcel Brands (NYSE:LB) , with a Zacks Rank #1, has long-term earnings per share growth rate of 10%.
L Brands (NYSE:LB) , with long-term earnings per share growth rate of 11%, carries a Zacks Rank #2 (Buy).
Wall Street’s Next Amazon (NASDAQ:AMZN)
Zacks EVP Kevin Matras believes this familiar stock has only just begun its climb to become one of the greatest investments of all time. It’s a once-in-a-generation opportunity to invest in pure genius.
L Brands, Inc. (LB): Free Stock Analysis Report
Children's Place, Inc. (The) (PLCE): Free Stock Analysis Report
Xcel Brands, Inc (XELB): Free Stock Analysis Report
GameStop Corp. (GME): Free Stock Analysis Report
Original post
Zacks Investment Research