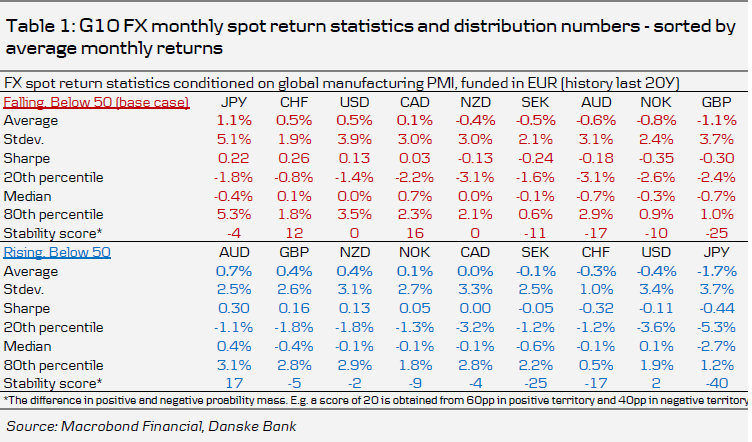
We provide an overview of historical G10 FX return distributions conditioned on the global industrial cycle. Investors that expect further deceleration should be long JPY, CHF and USD and short GBP, AUD, SEK and NOK. Investors that are more upbeat should be long AUD, GBP and NZD - but stay on the side-lines in Scandies until the industrial cycle expands again - and short CHF, USD and JPY.
Currency pairs are determined by a vast number of different drivers of which a key one is the global business cycle. Importantly, changes in countries' net international investment positions mean mapping the global business cycle into FX space should be regarded as a dynamic exercise. That said, we still think looking at historical return statistics and distribution metrics gives us important insights at a time where one of the key questions for investors is whether the global industrial cycle is set to stabilise or decelerate further. Our base case is a further deceleration (chart 1) but return statistics are naturally bias-free.
In this one-pager we show return statistics for G10 currency pairs conditioned on the global manufacturing PMI based on four phases: (i) Falling PMI below 50 (red), ii) rising PMI below 50 (blue), rising PMI above 50 (green) and (iv) falling PMI above 50 (yellow). Note these phases are not identical to the ones from MacroScope (17 September), as they do not take into account a view on the output gap and are hence much simpler in nature. With this year's manufacturing PMI drop below 50, we focus on monthly return statistics (vs EUR) for the 'red' and 'blue' phases but similar analysis is applicable for 'yellow' and 'green'. We use a 20Y history, in which period we have had 29 and 21 months in 'red' and 'blue', respectively.
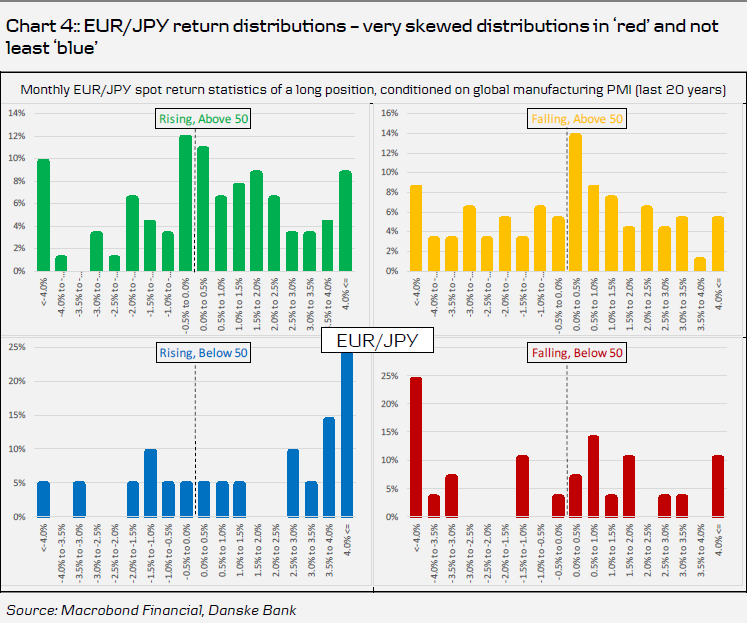
'Red'. Investors that believe in 'red' should be long JPY, CHF and USD and short GBP, AUD, SEK and NOK. Table 1 provides the details of the historical return distributions. It is especially noteworthy how right-skewed JPY returns have been in 'red' compensating investors for a median negative monthly return (!), i.e. when JPY strengthens, it tends to do so a lot with an 80th percentile of a large 5.3% m/m spot gain. This also illustrates the neat hedging properties of the JPY for a long equity portfolio. Scandi average and median returns are negative, as expected, in 'red' (chart 2 and 3) but surprisingly GBP delivers the most negative stability score. That means of all G10 currencies GBP is the currency that has provided negative returns in the largest share of months in 'red'. Arguably politics will prove a deciding factor for GBP near term, but table 1 adds arguments to our cautious GBP view from FX Strategy: EUR/GBP-don't forget: optimism can be fleeting, 23 September.

'Blue'. History suggests investors should invest in AUD, GBP and NZD and short CHF, USD and not least the JPY. Again, the JPY return statistics are remarkable with a short position providing both the highest sharpe ratio and stability score of all G10 currencies across all four phases! A little surprisingly, the Scandies do not stand out as particularly attractive in 'blue' - especially not the SEK. Common to both NOK and SEK is that we historically have needed global manufacturing PMIs above 50 before the two yield consistent positive returns. In other words, even if PMIs move higher next month we should probably not expect strong NOK and SEK performance before the global industrial sector expands again. Interestingly, the historical USD return distribution goes from right- to left-skewed when moving from 'red' to 'blue'. While a causation issue is at play here, with the USD (and Fed) important for global monetary conditions, it does suggest a much more cautious USD view, if we stay in 'blue' as this has been associated with larger drawdowns.

