STOCKS:
The European debt contagion remains front and center. Spain and Italy bond yields have moderated for the time being after last week’s ECB and Draghi comments that he will do “anything” to save the Eurozone. Now, clear action must be taken on the European’s part, or the market shall punish them accordingly Also, China remains on a growth deceleration curve, with growing concerns of a very hard landing — various estimates are centering in on the 7.0% level and even lower.
STRATEGY: The S&P 500 remains above long-term support at the 160- wma at 1206; which delineates bull/bear markets. However, the 200-dma support zone at 1266-to-1278 remains the bulls “Maginot Line”, while overhead resistance at 1340-to-1360 was violated on Friday. Moroever, a bullish key reversal higher took place in the S&P and note/bond yields; we’ll question whether high yields won’t feed the S&P tiger in a belly filling excercise given the public has retreated from the markets.
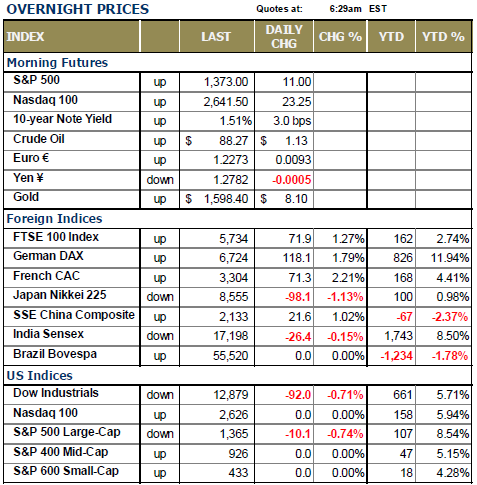
WORLD MARKETS ARE MOSTLY HIGHER, BUT THE FOCUS IS UPON EUROPEAN MARKETS as they opened “flat”, and then proceeded to move very sharply higher – Germany is higher by +2.2%, while France is higher by +2.4%. Spain and Italy are higher as well…up +3.0% and 4.1% respectively. Of course this is providing a lift to the S&P futures on the order of +11 points; US interest rates are rising, European rates are falling; gold and silver are higher; and the US dollar is lower. So far, this is a “riskon” day.
But lo and behold we have the US Employment Situation Report that was released at 8:30am EST. The consensus was for non-farm payrolls to increase by +100k, with private payrolls rising by +110k. The unemployment rate is expected to remain at 8.2%. Certainly the ADP private pay roll report gave rise to the economists bidding up their figures for a bit stronger employment figure.
In fact, the figures came in “stronger-than-expected”, with non-farm payrolls rising by +163k, with private payrolls rising +172k. This is far stronger than the highest Street estimate; we’ll take it as a positive. The unemployment rate however, rose to 8.3% as more people looked for work. As for the S&P futures – they were +11 points higher going into the report, and they are now +16 points higher.
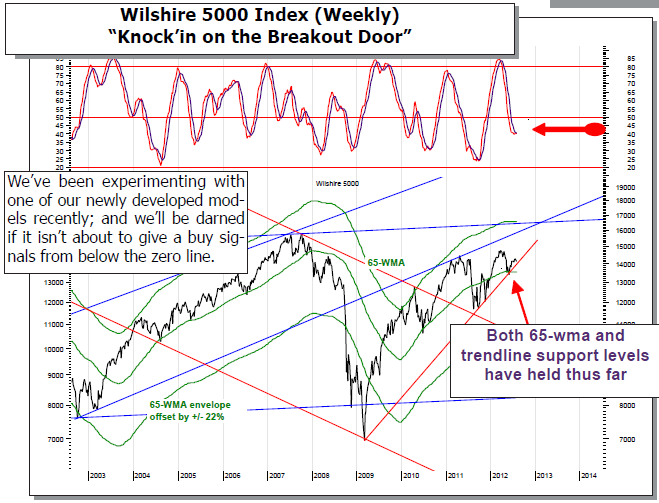
TRADING STRATEGY: Today we illustrate the Wilshire 5000 Index on a weekly basis; and we do so with a new model we’ve developed and have been working with as of late.
At this point, it on the verge of giving a buy signal, which we must take constructively given that the 65-week moving average as well as the major rising trendline support level have held any and all recent declines. Once each of those are broken, then we can react to the downside with impunity; until then, we must be buyers of weakness.
Today, we’ll move into the Russell 2000 Small Caps 2x Long Leverage (UWM); and we’ll start with a 10% position. Yesterday, the Russell tested its 400-day exponential moving average again and held; this is the 4th time since May this has occurred, and each resulted in a rally of tradable consequence. We’ll look to add to the trade accordingly.
To Read the Entire Report Please Click on the pdf File Below.
