In recent months trading some of the major pairs has been a frustrating business. For those of who love to trade trends and breakouts they have been fairly non-existent, especially for EURUSD and GBPUSD.
This has been frustrating for some and led to a lot of false signals. Not that long ago for example EURUSD was lingering well below 1.30, next it looked like 1.3500 was in sight and now the single currency is hovering somewhere in the middle. In a mere few months we have swung from the bears being in the ascendency to the bulls and now it feels like we are in no-man’s land.
Indeed range-trading markets in FX can be frustrating, but we should all get used to it. Far from being an anomaly in FX, FX markets tend to get stuck in range-trading ruts the bulk of the time. As a general rule FX markets tend to range trade 70% of the time and trend for only 30%.
However, trends tend to grab the headline and range-trading is the fairly unsexy end of FX trading that gets little air time. But when looking at FX markets it’s important you know how to deal with a situation when a trend just ain’t forthcoming.
Range – what range?
For longer-term traders the EURUSD rate might look like it’s not trending, however for those who have a “scalping” trade style trends are a plenty. Take a look at the chart below. This is a daily EURUSD chart. As you can see no real trend has been in place since the start of the year. 1.26 looks like a bottom, but the bulls have been thwarted every time they try to reach 1.35.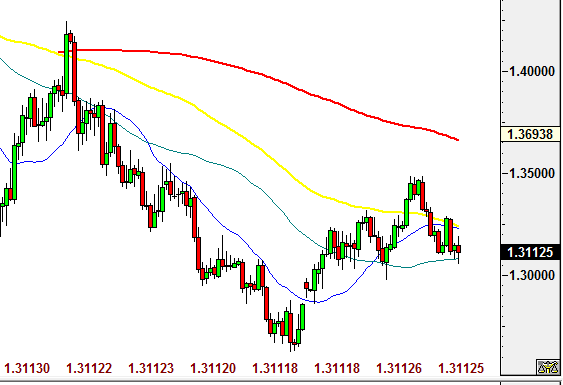 However, this is the 15 minute chart from Tuesday evening UK time. As you can see much more trending is going on – the careful scalper would have seen the dip to 1.3050 as a false break, and chosen to ride the reversal out to 1.3125 – a cluster of very short/term moving averages.
Of course, this strategy is incredibly risky and one rogue move in the market can take you out of your position extremely quickly. 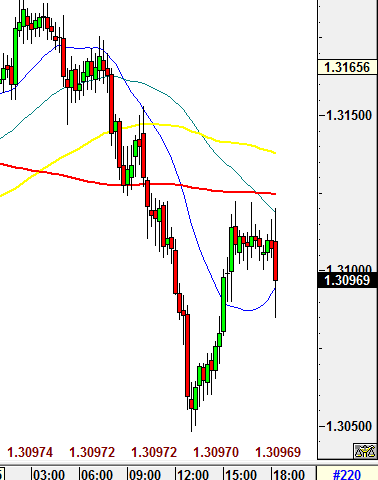
The range is your friend:
If scalping isn’t for you and you prefer a longer-term strategy then it’s worth getting acquainted with some range-trading strategies.
The first thing is do is to detect whether a market is range trading or trending. There are a few ways of doing this. The technical definition of a range is price action between two horizontal lines - between support and resistance. Thus, finding out where support and resistance levels lie is the most crucial thing you can do if the market is trading in a range.
Another common way to detect ranges is to look at the angel of the moving average. If the moving average is rising steeply then it suggests the trend is higher, likewise if it is sharply lower then the market is most probably in a downtrend, but if it is flat then it suggests that the market isn’t in a trend. For those of you familiar with Ichimoku analysis, when the price action is taking place within the cloud, then markets are not trending.
GBPUSD daily chart – the price action has been mostly in the cloud for the last few months, indicating a market that is not ranging. 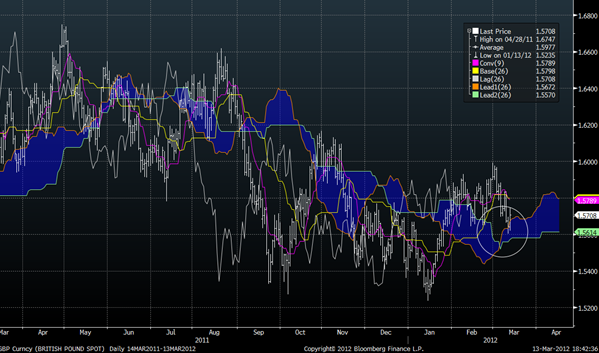
Another thing to note is that when key resistance or support levels are reached then one of three things tends to happen: either the level is broken significantly, there is a reversal, or a market ranges for a while. So ranges can happen extremely frequently.
It is also possible to use fundamental analysis to determine if markets will be in ranging or trending modes. Usually in the build up to big events like an FOMC meeting the markets will trade in a tight range until it gets clarity form the Fed. Right now, some asset classes are in typical range-bound territory: the Eurozone crisis has plateaued but is not over, the markets are considering the effect of central bank tightening in the future and what this may do to risky assets in particular and global growth is patchy. Hence why the bulls and the bears can’t reach a consensus on what is going on.
So what can we do if markets are range trading for the long-term?
At this stage it’s worth pointing out the key assets that seem to be stuck in a range based on the daily charts: EURUSD, GBPUSD, EURGBP, Swiss crosses, Treasuries, Gilts, and peripheral European yields along with gold.
If these are your favoured trades then you need to get yourself a range-trading strategy.
1. identify support and resistance for the time frame you are looking at. If you are trading gold then good support seems to lie at $1,680 – the 200-day moving average, while $1,800 is acting as fairly tough resistance.
Gold: daily chart 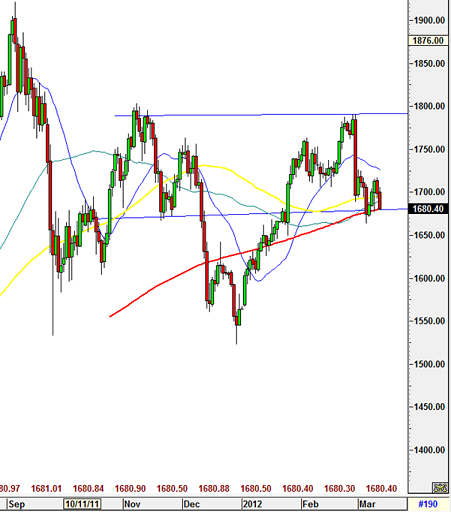
2. this is pretty much your range trading strategy. You may want to set an alert to sell when the price gets to $1,800 as it may start to look overbought – (use MACD and RSI indicators to help detect this) and buy when it gets down to $1,700 as some traders may believe that gold is now oversold and is thus good value. As you can see in the chart below, the gold price is close to support at $1,680, and the Relative Strength Index is pointing lower. The RSI is not yet in oversold territory, so it could mean there is further downside for the gold price. In this instance if you are using a range trading strategy it is worth looking at the fundamental picture to see why gold may fall below its support level – in this instance the Federal Reserve had concluded a meeting and left policy unchanged and sounded fairly optimistic on the economy, thus helping to boost the dollar. Since gold is priced in dollars this put downward pressure on the precious metal.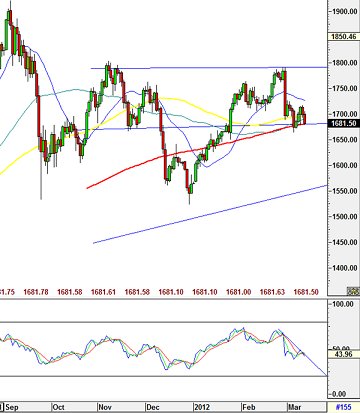
3. This leads us nicely into the last tip to help you trade ranges. Sometimes support and resistance levels are not respected. When we approach key levels check the candle stick patterns: a doji, head and shoulders, in verse H&S and double top or bottom all indicate that reversals may happen and the range could persist. However, if you don’t see this be wary, the range may overshoot your support and resistance levels so be on your guard.
But there are trends if you look closely:
Indeed, even though it looks like EURUSD might not be going anywhere fast there are some pairs out there that are trending. USDJPY has had a major reversal and now looks like it may head to 85.00. Likewise, the Canadian dollar and Mexican Peso have also performed well versus the Aussie dollar. Australia’s economy is being hit by China’s downward revision to growth while the CAD and the Mex are benefitting from their close links to the US economy, which is showing signs of improvement, and from the fact they are oil producers and as long as tensions between Iran and Israel persist then the oil price is at risk of moving higher.
To conclude, sometimes markets can be frustrating to trade but if you look hard enough then the trends are out there. And if they are not then get yourself a robust range-trading strategy like the one above.
- English (UK)
- English (India)
- English (Canada)
- English (Australia)
- English (South Africa)
- English (Philippines)
- English (Nigeria)
- Deutsch
- Español (España)
- Español (México)
- Français
- Italiano
- Nederlands
- Português (Portugal)
- Polski
- Português (Brasil)
- Русский
- Türkçe
- العربية
- Ελληνικά
- Svenska
- Suomi
- עברית
- 日本語
- 한국어
- 简体中文
- 繁體中文
- Bahasa Indonesia
- Bahasa Melayu
- ไทย
- Tiếng Việt
- हिंदी
Fundamental Update: What to Do When the Markets Aren’t Trending
Published 03/14/2012, 10:25 AM
Updated 05/18/2020, 08:00 AM
Fundamental Update: What to Do When the Markets Aren’t Trending
Latest comments
Loading next article…
Install Our App
Risk Disclosure: Trading in financial instruments and/or cryptocurrencies involves high risks including the risk of losing some, or all, of your investment amount, and may not be suitable for all investors. Prices of cryptocurrencies are extremely volatile and may be affected by external factors such as financial, regulatory or political events. Trading on margin increases the financial risks.
Before deciding to trade in financial instrument or cryptocurrencies you should be fully informed of the risks and costs associated with trading the financial markets, carefully consider your investment objectives, level of experience, and risk appetite, and seek professional advice where needed.
Fusion Media would like to remind you that the data contained in this website is not necessarily real-time nor accurate. The data and prices on the website are not necessarily provided by any market or exchange, but may be provided by market makers, and so prices may not be accurate and may differ from the actual price at any given market, meaning prices are indicative and not appropriate for trading purposes. Fusion Media and any provider of the data contained in this website will not accept liability for any loss or damage as a result of your trading, or your reliance on the information contained within this website.
It is prohibited to use, store, reproduce, display, modify, transmit or distribute the data contained in this website without the explicit prior written permission of Fusion Media and/or the data provider. All intellectual property rights are reserved by the providers and/or the exchange providing the data contained in this website.
Fusion Media may be compensated by the advertisers that appear on the website, based on your interaction with the advertisements or advertisers.
© 2007-2024 - Fusion Media Limited. All Rights Reserved.
