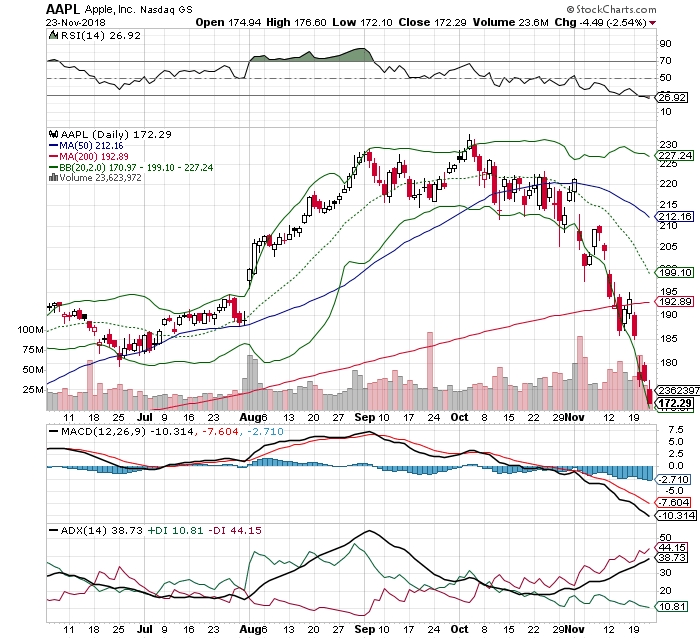
What is a very interesting statistic for Apple Inc. (NASDAQ:AAPL) shares which closed on November 23, 2018 at $172.29? On January 2, 2018 the first trading day of 2018 the shares of Apple Inc closed at $172.26. After reaching the year-to-date high price of $233,47 on October 3, 2018 and gains of 29.72% on a year-to-date basis, during less than two months the shares have lost all these gains and are now at the price level where they started trading during the first day of the year.
What lies ahead for Apple Inc. (AAPL), being the first company ever with a market capitalization over $1 trillion, now with a market capitalization only at $817.585B? In this article we will present some fundamental reasons and our valuation based on a dividend discount model (DDM) arguing that at these levels shares of Apple Inc. (AAPL) are a very attractive investment.
Key Statistics for Apple Inc. (AAPL):
Sector: Technology
Industry: Consumer Electronics
52 Week Range: $150.24 - $233.47
Close on November 23, 2018: $172.29
Beta (3Y Monthly): 1.21
PE Ratio (TTM): 14.47
Forward Dividend & Yield: $2.92 (1.51%)
Market Cap: $817.585B
Source: Yahoo (NASDAQ:NASDAQ:AABA) Finance
Financial Ratios Analysis
Financial ratios fall into several categories. For the purpose of this financial analysis, the commonly used ratios are grouped into five categories: activity, liquidity, solvency, profitability, relative valuation. We will examine the trend for the past five years, 2018-2014 for the first four categories of financial ratios as relative valuation will be mentioned later in our valuation analysis.
Fiscal Year
2014-09
2015-09
2016-09
2017-09
2018-09
Activity Ratios
Inventory Turnover
57.94
62.82
58.64
40.37
37.17
Fixed Assets Turnover
9.82
10.85
8.71
7.54
7.07
Asset Turnover
0.83
0.89
0.70
0.66
0.72
Liquidity Ratios
Current Ratio
1.08
1.11
1.35
1.28
1.12
Quick Ratio
0.82
0.89
1.22
1.09
0.99
Solvency Ratios
Debt/Equity
0.26
0.45
0.59
0.73
0.87
Financial Leverage
2.08
2.43
2.51
2.80
3.31
Profitability Ratios
Net Margin %
21.61
22.85
21.19
21.09
22.41
Return on Assets %
18.01
20.45
14.93
13.87
16.07
Return on Equity %
33.61
46.25
36.90
36.87
49.36
Source: Morningstar
It is noteworthy that the tax rate for FY2018 is at 18.34% the lowest rate in the past five years of financial analysis. A lower tax rate is positive for future profitability and valuation. Activity ratios measure the efficiency of the company in using its resources and the 5-year trend for Apple Inc shows a deterioration. Although a low turnover implies weak sales and possibly excess inventory, a low inventory turnover rate may be a good thing, especially when prices are expected to rise or when shortages are anticipated. The company has nice liquidity ratios, and although debt has increased significantly during the past years it does raise any concerns. The financial leverage or asset to equity ratio shows that more assets have been funded with equity, and this higher ratio is acceptable when a business has a long history of consistent cash flows, and those cash flows are expected to continue. And Apple Inc has both positive and growing free cash flows during the 5-year period we examine, with a figure of $64,121 million in FY 2018, an increase of 26,20% compared to $50,803 in FY 2017. Growing positive free cash flows lead to higher valuations in a DCF model. Profitability ratios show that Return on Equity for FY2018 is at its highest level for the past 5 years and both Net Margin and Return on Assets have increased in FY 2018 compared to FY 2017. Plus, the company has 5 years of consecutive dividend growth and only a conservative payout ratio of 24.52% (trailing twelve months of earnings).
Growth in key financial metrics
The company is growing as the 5-year averages for revenue, operating income, net income and eps are 9.22%, 7.67% 9.96% and 15.97% respectively.
What are key risks for Apple Inc?
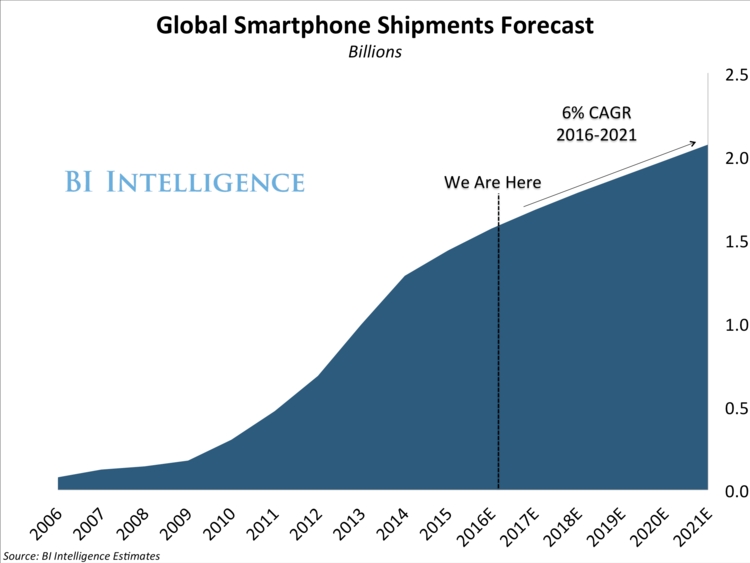
Strong labor market and tariffs will probably drive up costs and reduce corporate profit margins. In the US interest rates are rising, and growth is slowing. Goldman analyst Rod Hall cut his stock price target to $182 from $209, citing concerns over “deteriorating demand,” following the technology giant’s disappointing holiday season guidance and revenue guidance cuts from multiple smartphone suppliers. A continuous trade war between USA and China is not a good scenario for Apple Inc, and neither is the fact that India has raised its imported tax rate on smartphones in 2018. Still the global smartphone market is growing, even at slower rates.
Valuation of Apple Inc
Current Valuation
AAPL
AAPL
Industry Avg
S&P 500
AAPL 5Y Avg*
Data as of 11/23/2018, *Price/Cash Flow uses 3-year average.
Price/Earnings
14.5
13.7
19.1
14.1
Price/Book
7.6
5.5
3.1
4.8
Price/Sales
3.2
2.4
2.1
3.1
Price/Cash Flow
11.1
0.1
12.8
10.1
Dividend Yield %
1.6
1.5
2.0
1.8
Forward Valuation
AAPL
AAPL
Industry Avg
S&P 500
Data as of 11/23/2018.
Forward Price/Earnings
13.2
—
16.7
PEG Ratio
1.4
—
—
PEG Payback (Yrs)
7.9
—
—
On a relative valuation basis Apple’s shares trade currently at a discount of 24% comparing its P/E ratio with the P/E of the S&P 500 as a benchmark. Also, the shares trade at a discount to the broader market having as a reference the Price/Cash Flow ratio and at a premium having a s a reference the Price/Book and Price/Sales financial ratios.
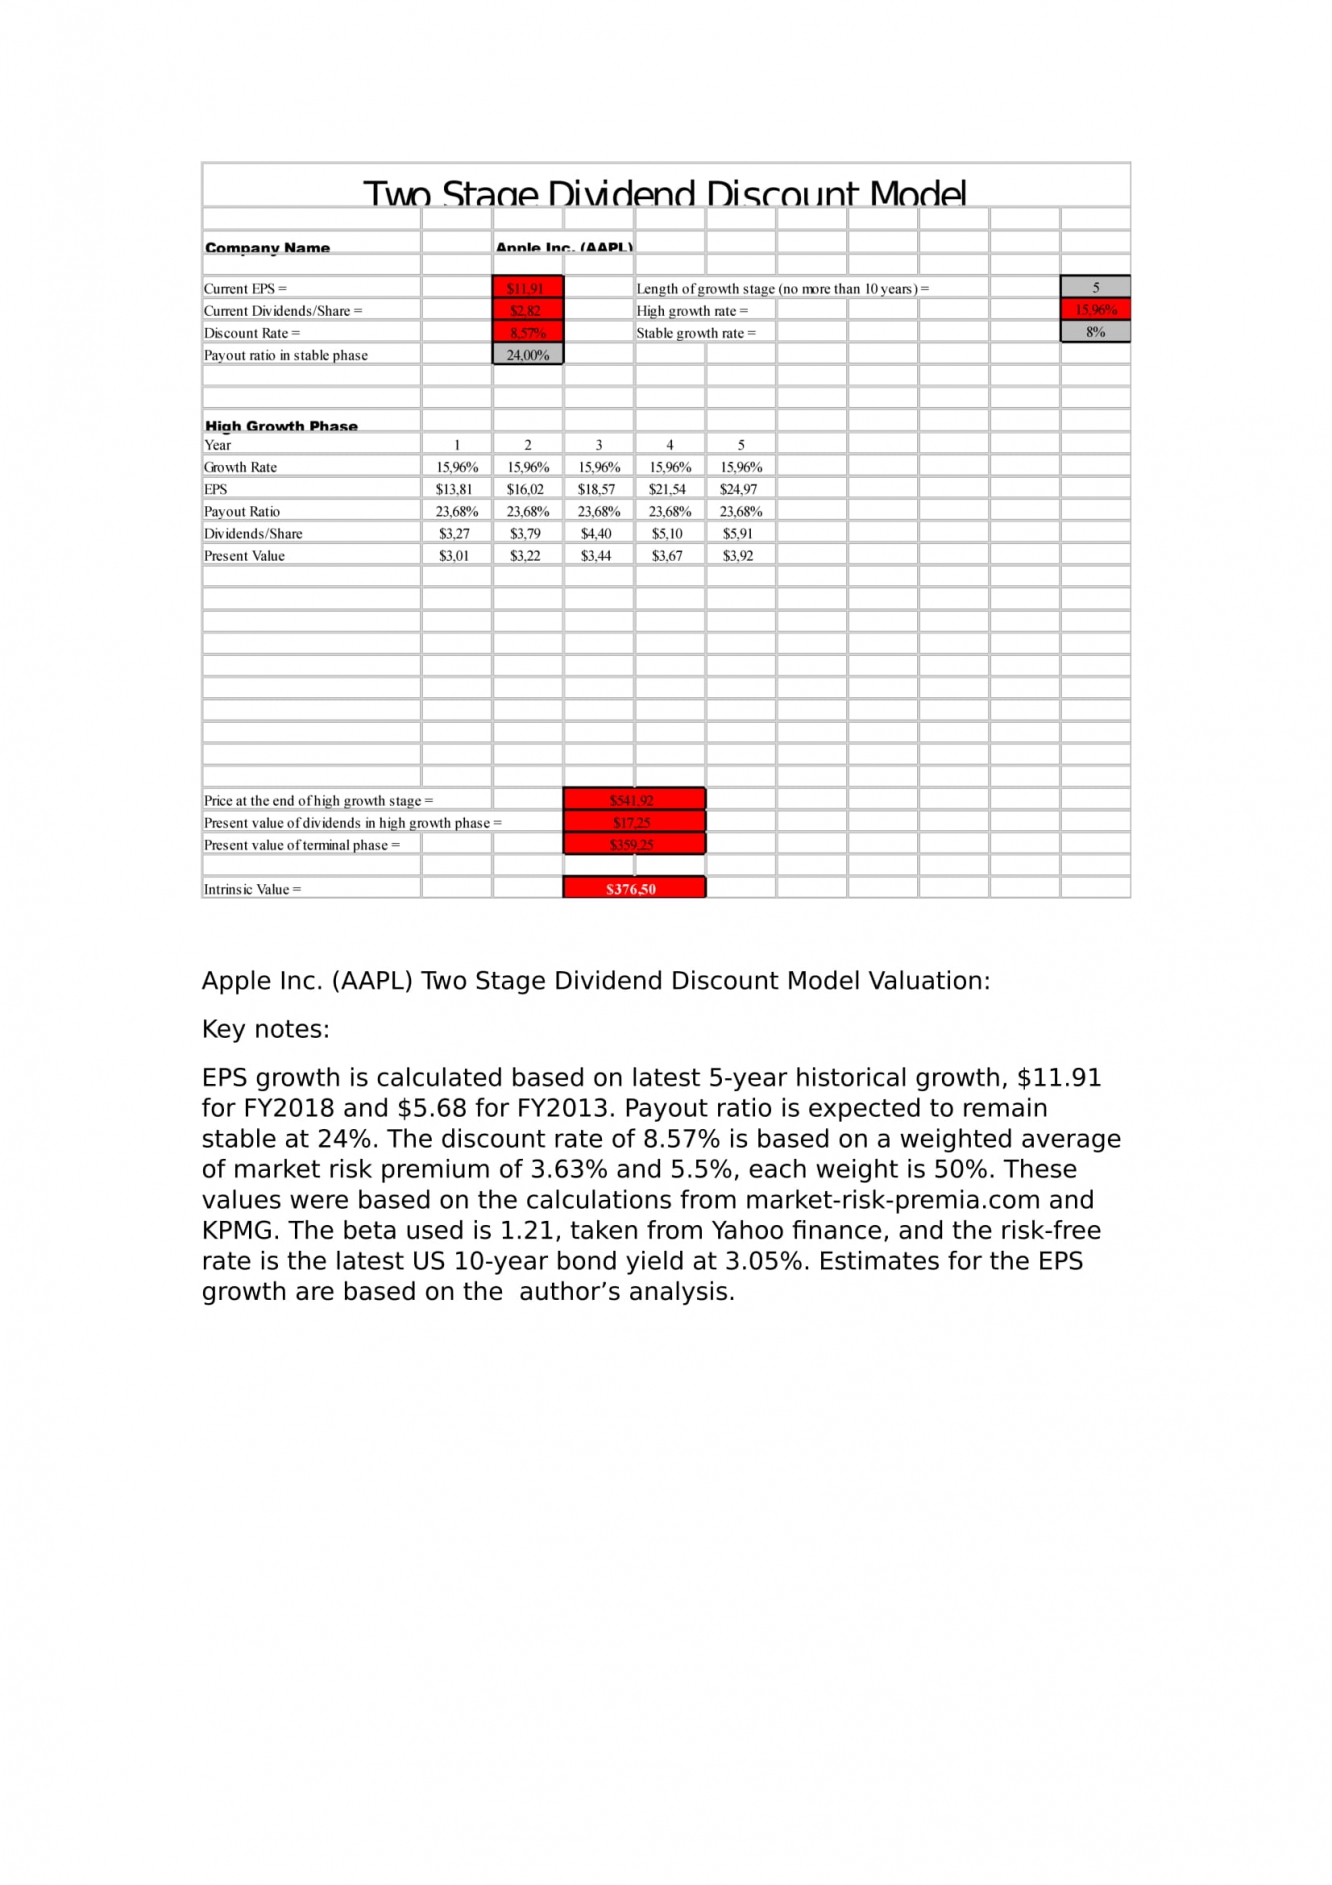
On an absolute valuation using a two-stage DDM model the intrinsic value of the Apple Inc share is $376.50.
Apple Inc. (AAPL) Two Stage Dividend Discount Model Valuation, Key notes:
EPS growth is calculated based on latest 5-year historical growth, $11.91 for FY2018 and $5.68 for FY2013. Payout ratio is expected to remain stable at 24%. The discount rate of 8.57% is based on a weighted average of market risk premium of 3.63% and 5.5%, each weight is 50%. These values were based on the calculations from market-risk-premia.com and KPMG. The beta used is 1.21, taken from Yahoo finance, and the risk-free rate is the latest US 10-year bond yield at 3.05%. Estimates for the EPS growth are based on the author’s analysis.
Technical Analysis
The recent selloff in the shares does not look good. The stock is now trading below its 50-period and 200-period daily moving averages at extreme oversold levels indicated by the value of RSI (14) indicator well below the 30 level. MACD indicator is negative and the ADX/DMI indicator show a strong trend, a downtrend.
Investment thesis conclusion
Based on our detailed DDM valuation, strong profitability, increased free cash flows and dividend yield I strongly believe that shares of Apple Inc (AAPL) are at the price of $172.29 significant undervalued. A 6-month or 1-year target would be the recent all-time high of about $233 per share.
Alternative Investment
Investors willing to explore an alternative investment performing their due diligence may consider to invest in Irish Whiskey. This alternative investment may be suitable for investors who wish to invest in a market with no correlation to the stock market, as it is expected to grow in the next years.
Legal Disclaimer
I do not own any shares of Apple Inc (AAPL) at the time of writing this article or plan to buy shares within the next 72 hours.


