
In October 2013, Fossil Group Inc (NASDAQ:FOSL) had a market cap of roughly $7.5 billion. The watchmaker was enjoying record sales and profits, which was supposed to propel FOSL stock, then hovering above $130 a share, even higher. Fast-forward six years and the company is currently valued at less than $650 million with the shares barely above $13. No trend lasts forever and Fossil’s 90% crash is a great reminder of that fact.
The first half of 2018, on the other hand, painted a different picture. A couple of decent earnings reports inspired the bulls to lift FOSL stock from ~$6 to ~$32. Unfortunately, the business was still too vulnerable to sustain such a high price.
Note that Fossil’s stock price headed south when its fundamentals were still looking very strong. Can the stock start climbing now, while the company is still weak? What the next earnings report will bring is anyone’s guess. Instead, let’s take a look at the situation through the prism of the Elliott Wave principle.
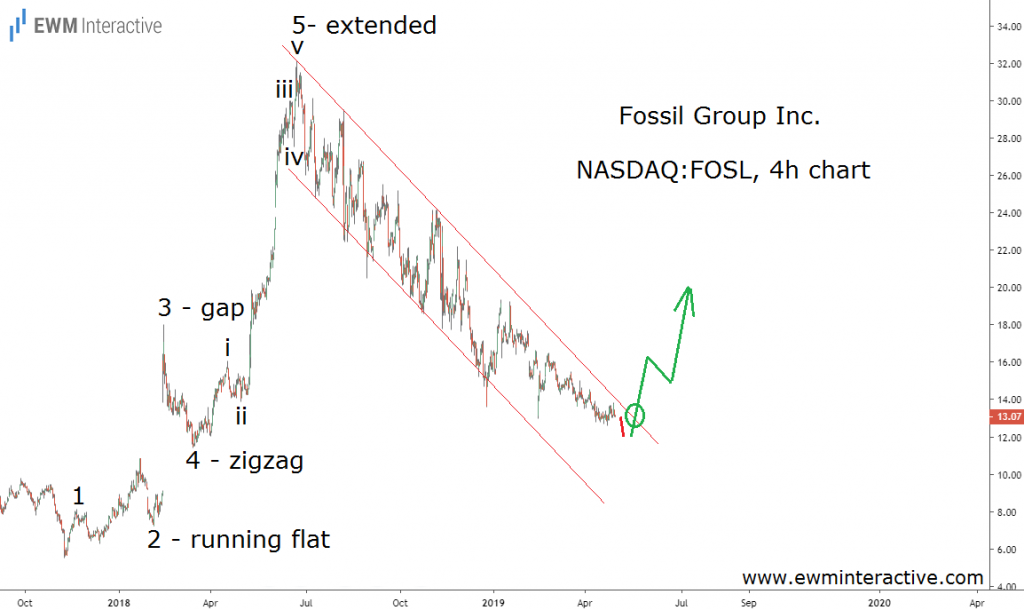
The 4-hour chart sheds light on the structure of FOSL stock’s behavior since the bottom at $5.50 in November 2017. The rally to over $32 by June 2018 can be seen as a five-wave impulse pattern, labeled 1-2-3-4-5.
Wave 3 is a big gap formation. In most cases, the third wave is the longest among waves 1, 3 and 5 in an impulse. Not this time though. In this impulsive pattern wave 5 is the extended one. Its sub-waves, labeled i-ii-iii-iv-v, are also visible.
The theory states that every impulse is followed by a correction, which usually erases all of wave 5’s gains. This rings true for FOSL stock even though wave 5 is very big. It took of from $11.40 and has been almost entirely retraced by the following decline.
Is FOSL Stock Forming a Base?
But that is not the most important part here. According to the Wave principle, once we have a complete impulse-correction cycle, we can expect the trend to resume in the direction of the five-wave sequence. This means that if this count is correct, the bulls should soon return and lift Fossil stock above the top of wave 5 in the long-term.
If you think the implied rally of roughly 150% is far-fetched, keep in mind that this very stock surged by over 430% in seven short months between November 2017 and June 2018. Besides, the company is in a much better shape now. It is getting rid of underperforming stores, reduced its net-debt to 0 and generated free cash flow equal to a third of its market cap in 2018 alone.
Fossil is definitely not out of the woods yet, but this Elliott Wave analysis suggests it can soon exceed investors’ low expectations.