The press is giving too much credence to the effect an interest rate hike would have on the markets and on the financial sector. First of all, the fact that the Fed has been debating whether or not to raise rates by a paltry meaningless 0.25 basis points speaks volumes. The Fed clearly understands that this recovery is nothing but smoke and mirrors; the main driving force behind being hot money.
Secondly, deflation is more of an issue than inflation. Take a look around you. You can start with oil and go down the commodity rung; copper, iron ore, coal, etc., are all trading significantly off their highs. Instead of marching to the drum beat of the naysayers, march to your own drumbeat; opportunity could be in the air.

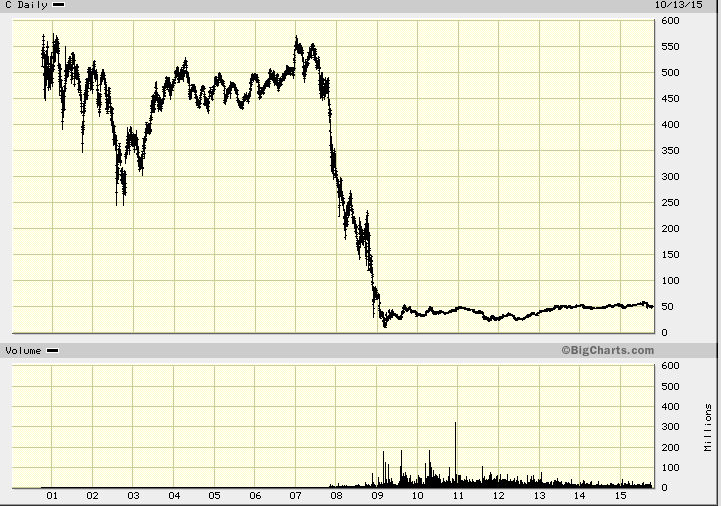
Let’s take a look at the once mighty Citibank (N:C). The long-term chart certainly looks terrible and the stock appears to have made hardly any headway since 2008. One could simply state that Citibank has not made much headway because it is a rotten stock, but other than perhaps bringing on a brief moment of satisfaction, it would change nothing. However, if you discard the lens of negativity and take a look at the chart in an unbiased manner, you might spot something many others are missing. We will re-examine this chart shortly. Are all the regional banks suffering like this? Logic dictates that there are strong players out there; take a look at the picture below 
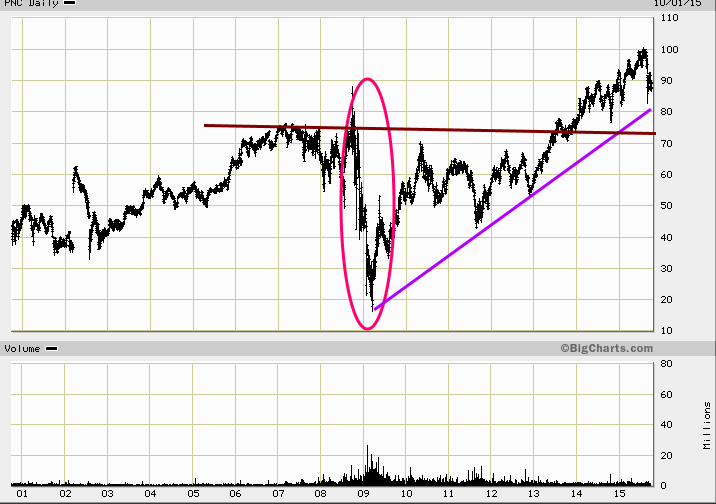
PNC Bank (N:PNC) appears to be thriving and the stock is trading well above its 2009 highs. One thing is certainly clear: every major market crash proved to be nothing but opportunity knocking in disguise. If one understands the principles of mass psychology, then just by utilizing this one tool you could do rather well, provided you are patient and buy when there is panic and sell when the crowd is euphoric. Don’t mistake bullish with euphoric.
PNC could test 72, with a possible overshoot to 67 before it attempts to challenge 100.00. As long as it does not close below 50 on a monthly basis, the outlook will remain bullish. The pullback to 72 is not a must, but if it did pullback to this range, it would make for a good place to deploy some money into this stock.
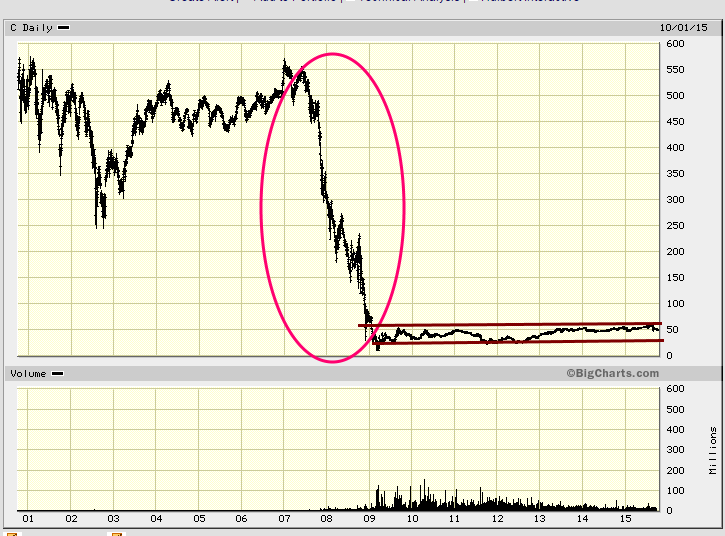
Now let’s take a look at Citibank, but through the eyes of an observer. An observer starts off on neutral ground and examines the data through a neutral lens 
While others might view the chart as disastrous, we see a potential opportunity. Notice the massive channel formation. The longer the channel formation, the stronger the breakout is when it finally occurs. As it has pulled back so much from its highs, the breakout is likely to occur to the upside. A monthly close above 63 will virtually guarantee a move to the 100 and then 150 ranges.
Suggested strategies for those willing to take on a bit of risk
Option number one:
Wait for a pullback to roughly the 38.00 ranges and then purchase LEAPS; these are options that have more than one year of time on them.
Option two:
Wait for a monthly breakout above 63.00 and then purchase leaps. The stock in question is Citibank. If you are looking for some of the strongest regional players, then you could put the following technique to use on PNC, N:BKU, N:STI, N:JPM, etc.

