Good afternoon, dear traders and investors. Today we will talk about the classic investment portfolio, based on GeWorko method. The portfolio components selected from the Top10 S&P500 golden list. The rating is assigned in accordance with the market capitalization on December 31th, 2013. More information about the index can be found on our website S&P500. For risk diversification, we chose one asset from each sector of the U.S. economy presented in Top10 S&P500: information technology, industrial production, energy, financial services and consumer goods. We assume weak relation between these sectors between each other. The weight of each asset is calculated by the Sharpe's method based on the Capital Asset Pricing Model, CAPM. The optimization result is the maximum of the return/risk ratio for the portfolio.
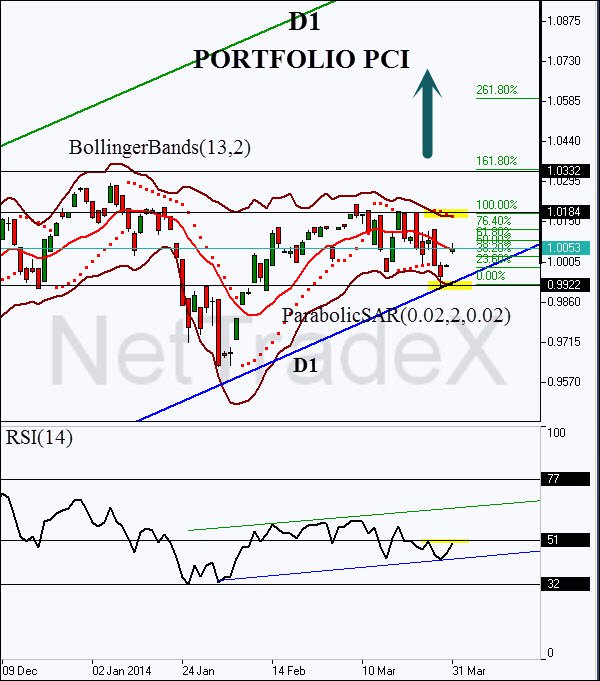
Optimization of weights was presented for the period 26.06.2013-14.03.2014. This period corresponds to the last uptrend existence term for the S&P 500. It is assumed that the dynamic direction of the index globally determines the portfolio price direction. Here we consider the daily chart of the portfolio created in NetTradeX. At the moment, the market situation provides convenient points for bullish trading, as it is seen in the figure.
Price drifts inside the sideways corridor near the daily rising trendline. Neutral movement significantly reduces the value of trend indicators such as ParabolicSAR. So the decisive importance for us is the behavior of oscillators warning of quitting the sideways channel. TheRSI(14) confirms bullish direction, and we expect the preliminary violation of the level 51 before the price gains an upward momentum. It is recommended to place a pending order above the resistance level at 1.0184. This level is confirmed by the latest values of the ParabolicSARand the upper Bollinger band. The preliminary target is slightly below the 161.8% Fibonacci system, but long-term traders can hold the position unless the price crosses the rising trendline channel downwards. This instrument assumes the positional trading due to the complexity of portfolio weight calculation.
- English (UK)
- English (India)
- English (Canada)
- English (Australia)
- English (South Africa)
- English (Philippines)
- English (Nigeria)
- Deutsch
- Español (España)
- Español (México)
- Français
- Italiano
- Nederlands
- Português (Portugal)
- Polski
- Português (Brasil)
- Русский
- Türkçe
- العربية
- Ελληνικά
- Svenska
- Suomi
- עברית
- 日本語
- 한국어
- 简体中文
- 繁體中文
- Bahasa Indonesia
- Bahasa Melayu
- ไทย
- Tiếng Việt
- हिंदी
Forex Technical Analysis PCI 2014-04-01
Published 04/01/2014, 10:15 AM
Updated 12/18/2019, 06:45 AM
Forex Technical Analysis PCI 2014-04-01

IFC Markets
3rd party Ad. Not an offer or recommendation by Investing.com. See disclosure here or
remove ads
.
Latest comments
Install Our App
Risk Disclosure: Trading in financial instruments and/or cryptocurrencies involves high risks including the risk of losing some, or all, of your investment amount, and may not be suitable for all investors. Prices of cryptocurrencies are extremely volatile and may be affected by external factors such as financial, regulatory or political events. Trading on margin increases the financial risks.
Before deciding to trade in financial instrument or cryptocurrencies you should be fully informed of the risks and costs associated with trading the financial markets, carefully consider your investment objectives, level of experience, and risk appetite, and seek professional advice where needed.
Fusion Media would like to remind you that the data contained in this website is not necessarily real-time nor accurate. The data and prices on the website are not necessarily provided by any market or exchange, but may be provided by market makers, and so prices may not be accurate and may differ from the actual price at any given market, meaning prices are indicative and not appropriate for trading purposes. Fusion Media and any provider of the data contained in this website will not accept liability for any loss or damage as a result of your trading, or your reliance on the information contained within this website.
It is prohibited to use, store, reproduce, display, modify, transmit or distribute the data contained in this website without the explicit prior written permission of Fusion Media and/or the data provider. All intellectual property rights are reserved by the providers and/or the exchange providing the data contained in this website.
Fusion Media may be compensated by the advertisers that appear on the website, based on your interaction with the advertisements or advertisers.
© 2007-2024 - Fusion Media Limited. All Rights Reserved.