
Daily Forex and Markey AnalysisFOREX
The Euro is still above 1.2700. It did hit 1.2809 then fell. The market then recovered from 1.2710 and now might test 1.2850. USD/JPY looks to be still trading from 76.55-77.05. We might test 76.55, if below that we see 76.10.
USD/CHF failed to recover back above 0.9500 with strength and we might test 0.9430-00. Cable has resistance at 1.5400 and might test 1.5150. Aussie has resistance at 1.0460 and we have support at 1.0320.
MARKETS
The Dow (12482.07) was up 0.50% and the NASDAQ (2728.08) rose 0.64%. On the DJIA we see key resistance at 12630.
The Nikkei is at 8480.99, up 0.17%. The Hong Kong is at 19650.11, this is up 0.11%). The Shanghai is at 2295.66, down 0.12%, Taiwan is at7216.28, down 0.075. In Australia, the market is at 4270.60, down 0.175.
COMMODITIES
Crude is now above 101. We could still end up testing 110 in the coming days. Immediate resistance is found at 103.30 then at 103.50.
Gold might test resistance at 1680. There is strong resistance at 1670-1700 first. A failure to break that could test support at 1600.
The Euro Increases by 150 Pips
Yesterday, the Euro was up almost 150 pips.
The market went from 1.2662 to 1.2808, and closed at 1.2734.
The 3 hour chart shows the market is moving around and testing the upper boundary of a downward channel.
Should the market move above the near term resistance (1.2808) might show us further testing of resistance levels.
Alternatively, a move below 1.2662 might test 1.2550.
The economic calendar in the EU is quiet today.
The market is above both the 20 and 50 EMA on the 1 hour chart. This indicators have twisted.
The Cable Shows Some Strength
On Friday, the GBP/USD made a Doji on the charts which helped it to rise above 1.5271.
We now see resistance at 1.5410. A move above that sees resistance at 1.5500 then 1.5530. 1.5530 happens to be the high seen on Friday. 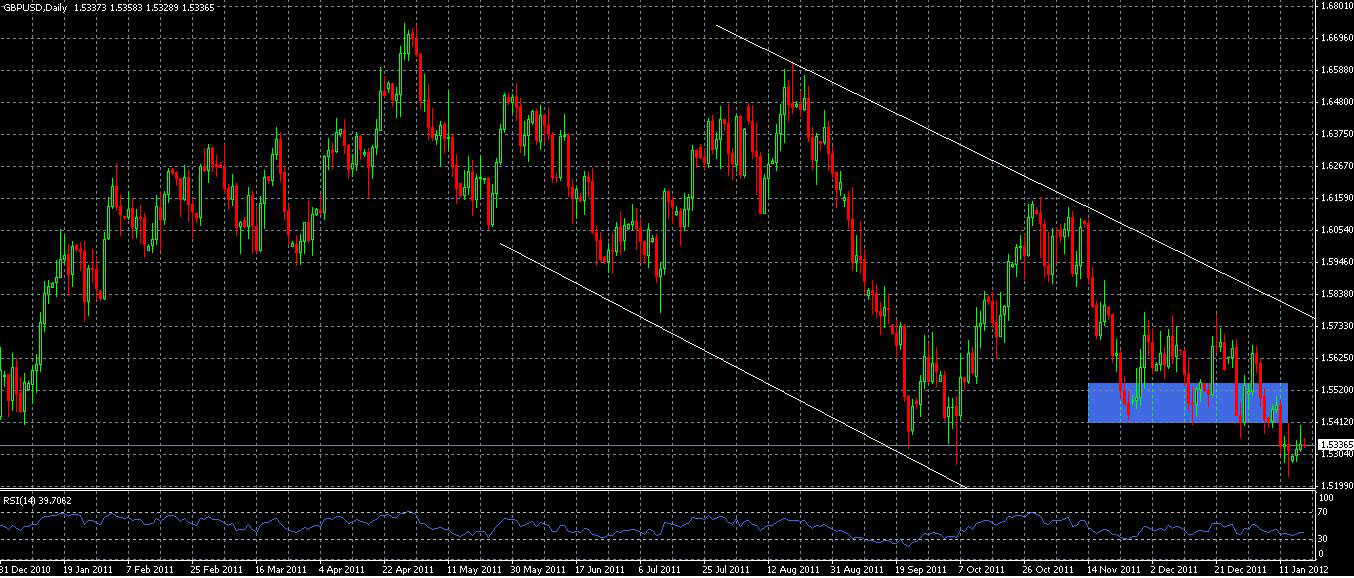 GBP/USD" title="GBP/USD" width="1362" height="581">
The Loonie Breaks Below 1.0185
The USD/CAD has fallen and is now around 1.0205 and might fall below the support at 1.0185.
We might see a trading range from the key support at 0.997 towards the key resistance at 1.0274.
Support: 1.010, 1.007, 1.002, 1.00, 0.997
Resistance: 1.020, 1.025, 1.027, 1.030, 1.037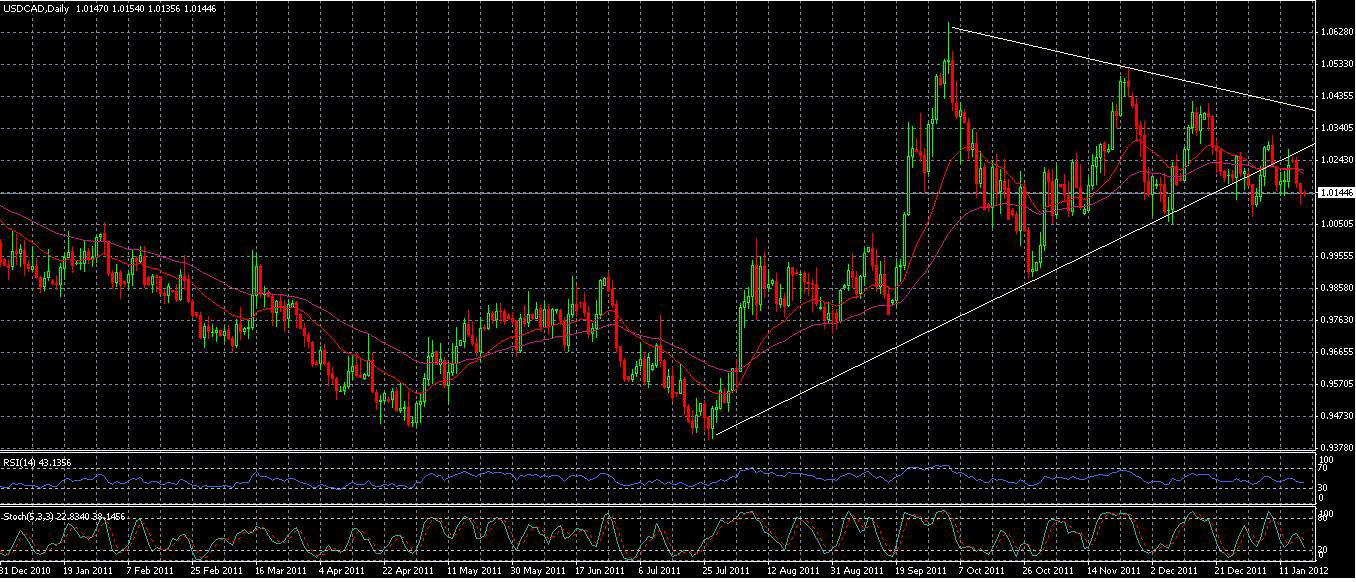 USD/CAD" title="USD/CAD" width="1375" height="560">
The Aussie Probes the Upper Trend Line
AUD/USD upper trend line resistance at 1.0463. If that breaks, we can test the 100% projection of 0.9662 to 1.0378 from 0.9861 at 1.0575. : We can still test the
Alternatively, if we see a break below 1.0226, we could then test 1.0148.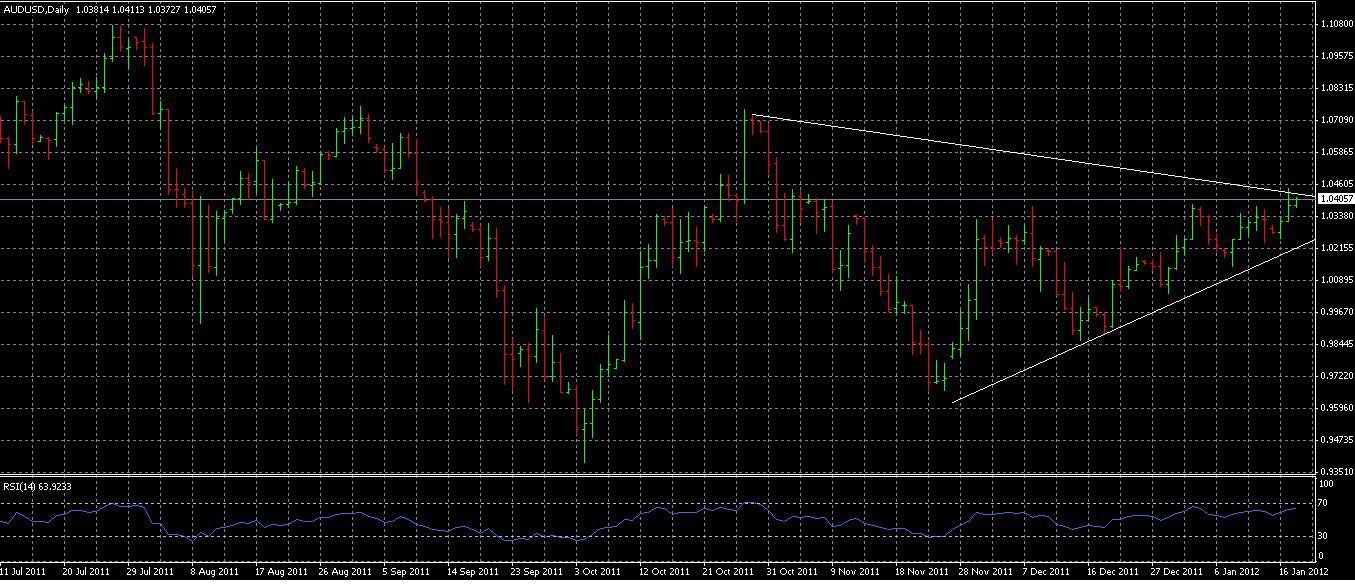 AUD/USD" title="AUD/USD" width="1370" height="563">