Daily Forex and Market ReportFOREX
The Euro might now test 1.2820or even 1.2765if the market can fall below 1.2900. USD/JPY is mixed, ranging at 76.60-83.
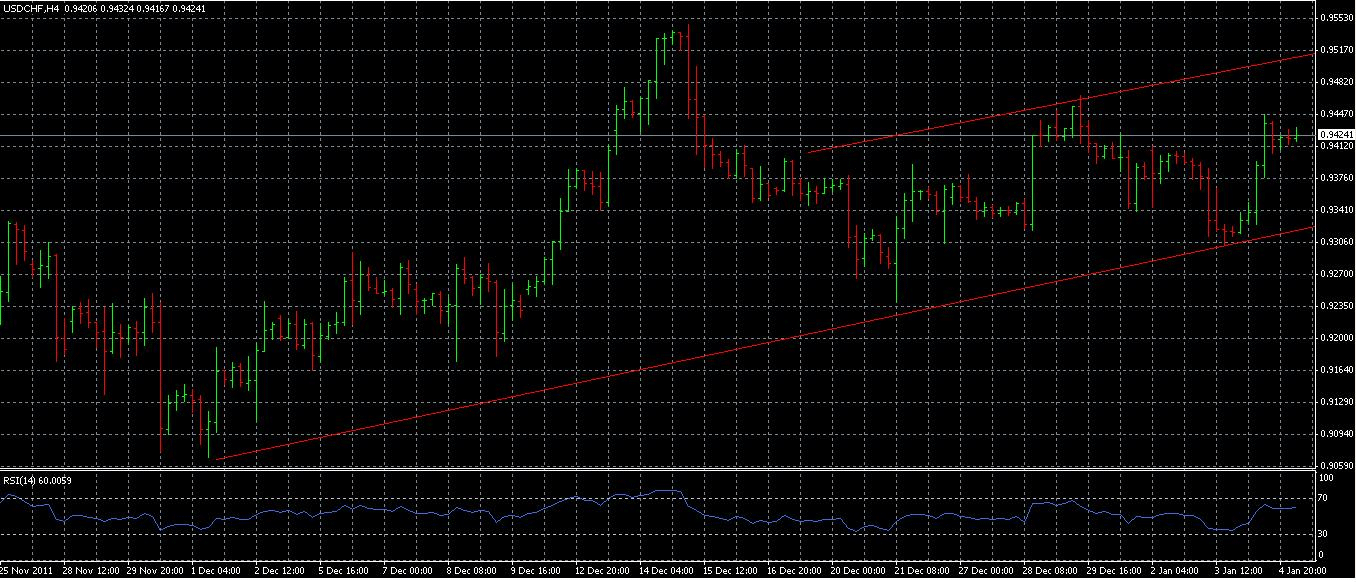
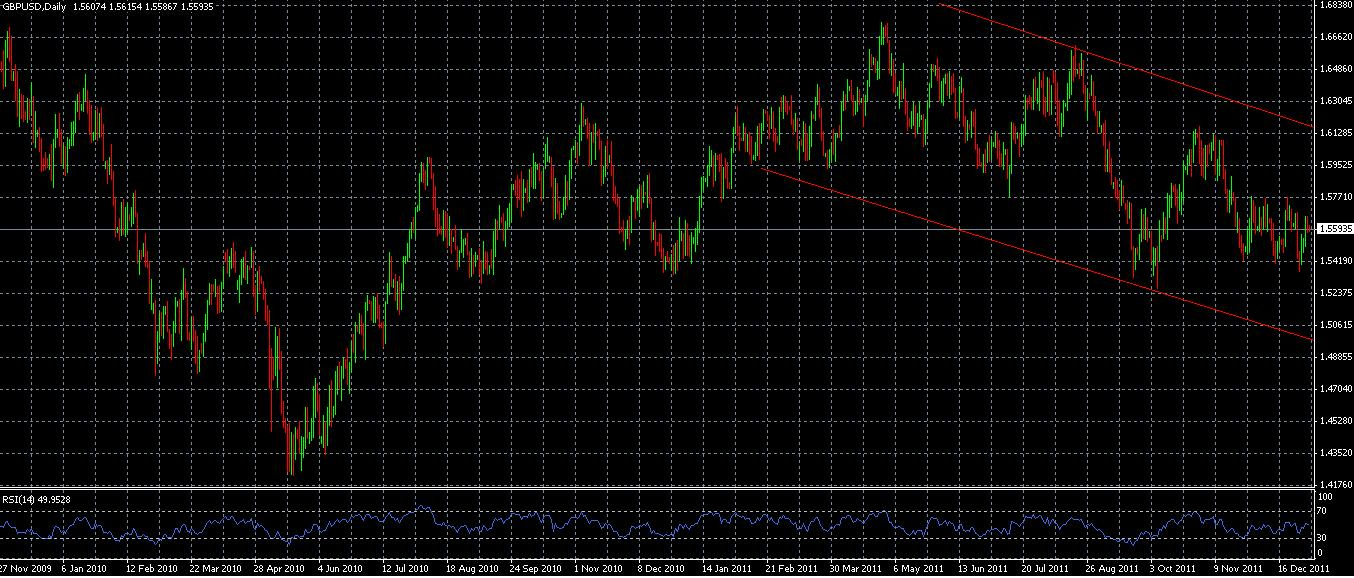
USD/CHF rose above 0.9400. The market might now test 0.9500. Cable also is trading mixed at 1.5575-5675 but is still maintaining a wide1.5400-5800 range. Aussie is also mixed at 1.0300-375.
MARKETS
The Dow (12418.42) rose 0.17%. The NASDAQ (2648.36) closed flat. The DJIA has strong resistance at 12500, and also has support of which is coming near 12250.
The Asian markets are having a mixed day all around. Hong Kong (up 0.43%) and Taiwan (up 0.18%), also, the Nikkei (down 0.54%), Shanghai (down 0.10%) and Australia (down 1.07%).
COMMODITIES
Crude (102.87) is still above 100 and with this so, we could still test 110+. Support is at 101.50.
Gold (1615.70) rose above 1600. We are seeing strong support at 1590. We might now test 1660 or 80.
China See Some Gains Today
Today saw Chinese markets in Hong Kong and Shanghai trading higher. This move is coming on strong hopes that the Bank of China will cut China’s bank reserve ratios.
Hong Kong’s Hang Seng Index was up 0.3%, while the Shanghai Composite added a modest 0.2%. In South Korea, the Kospi added 0.4%.
Japan’s Nikkei fell 0.6%, and Australia’s S&P/ASX 200 index also shed 1.2%.
This mixed day in the Asian markets follows a rather weak and mixed day for US Markets. The DJIA was only up a littleas upbeat domestic retail and cars sales data helped calm investors as renewed Euro zone debt issues emerged.
Adding fuel to the fire were reports that Spain may apply for more financial aid.
The Euro Falls Below 1.2915
The Euro, recently, fell below 1.2915. This is negating a bullish rally we saw from 1.2858.
We might now test towards 1.2858 where we might see a new low formed. The August 2010 low at 1.2589 is the next strong level of support. However please watch the pivots at 1.2840 and 12735.
Alternatively, we see resistance levels at 1.2971 and 1.2994.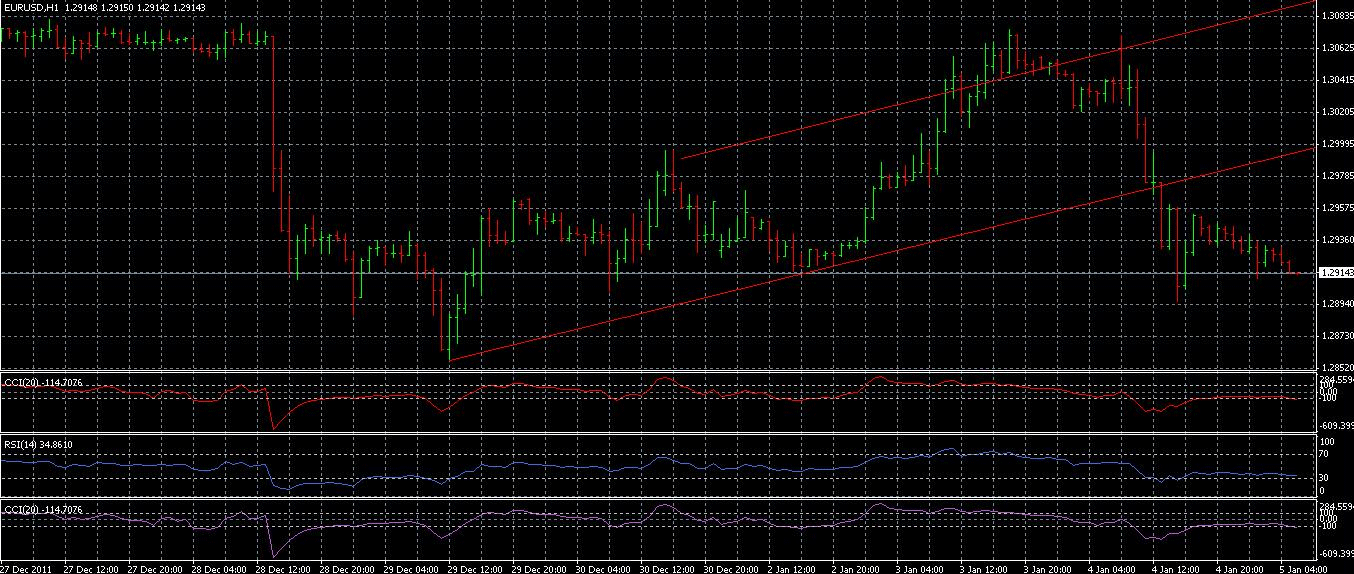
USD/JPY Dips Below 77.14
Recently this market fell below 77.14. This might signal a new downward trend in the USD/JPY.
We could be seeing some increased volatility as this has increased over the last few trading sessions, so we could test even lower in the coming days.
Looking up, we are seeing strong resistance near 77.20/60. 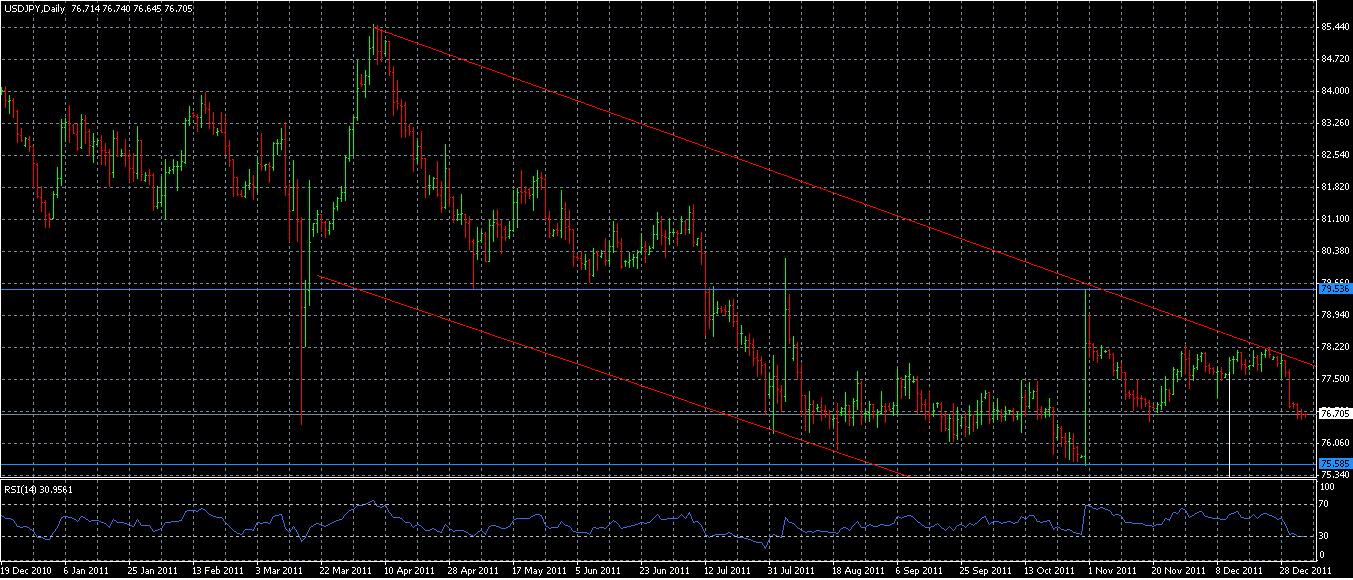
The Aussie Could Show Some Strength
Since July we are seeing bullish triangle and also a bearish triangle which formed since the October low. This formation could be indicating a possible test of 1.0510. This could also be a strong resistance level which might cap rallies.
Alternatively, we are seeing support levels at 10300 and 1.0275 and then just above 1.0200. A move below 1.0200 could test 1.0040.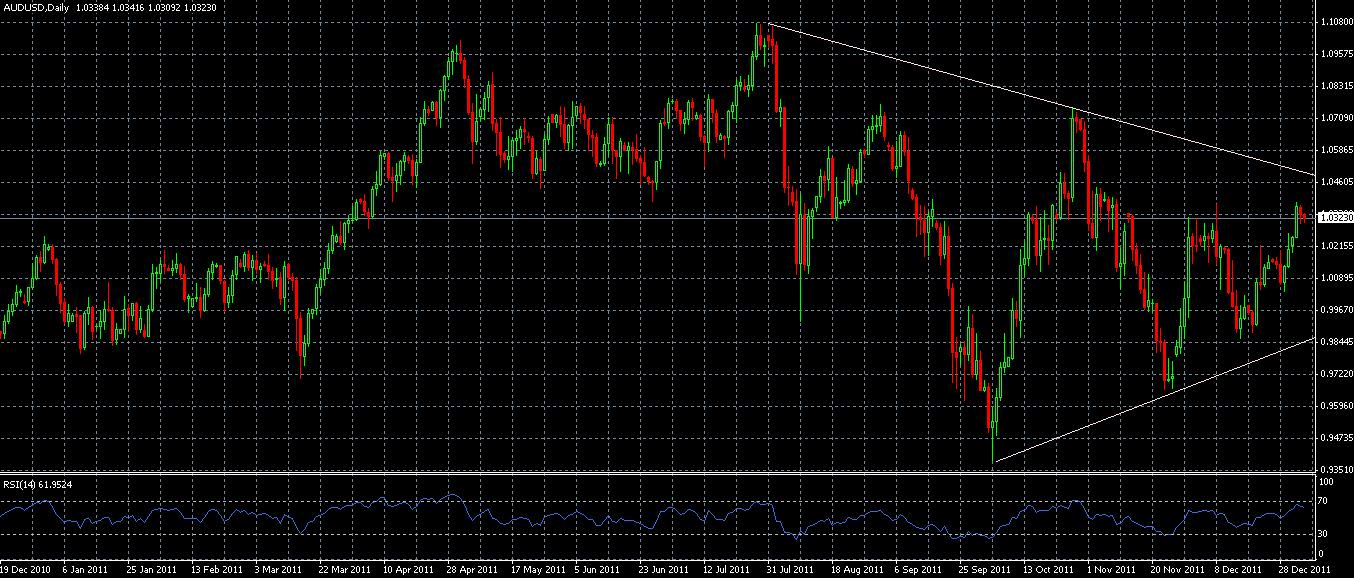
The GBP/USD Remains Below December Highs
The Cable remains below its December highs. However, the RSI is at a level that helped the market reach its December tops. It is near 50 at this time.
A move higher could test 15800 this week. We are seeing resistance levels at 15690 and 15730.
Alternatively, we see support at 15545. The broad model suggests some broad consolidation at this point within some sideways trading.
The Swissy Has Been a Bit Volatile
The USD/CHF reversed after its RSI dip to 50.
Since all the wildness we have seen since 12/15, we could be seeing a triangle forming. If this is true, we could see some more sideways consolidation before the market tests above the resistance at 9550.
We see resistance is 9470 and higher up at 9532.
Looking down we see supports at 9380 and then 9400.