Last week's U.S. Dollar/Canadian Dollar, symbol USD/CAD, had an interesting chart pattern. Based on the main range of .9406 to 1.0667, a retracement zone has been created at 1.0031 to .9884. Since crossing the 50% level at 1.0031 the week-ending January 27, this currency pair has straddled the zone, finding resistance at the upper level and support at the lower Fibonacci level at .9884.
Although the main trend is down, a main bottom has formed at .9841, creating a support base and giving the currency pair a slight bias to the upside. Earlier last week, traders once again rejected 1.0031, setting up the market for a possible retest of the lower boundary at .9334. This type of trading indicates indecision.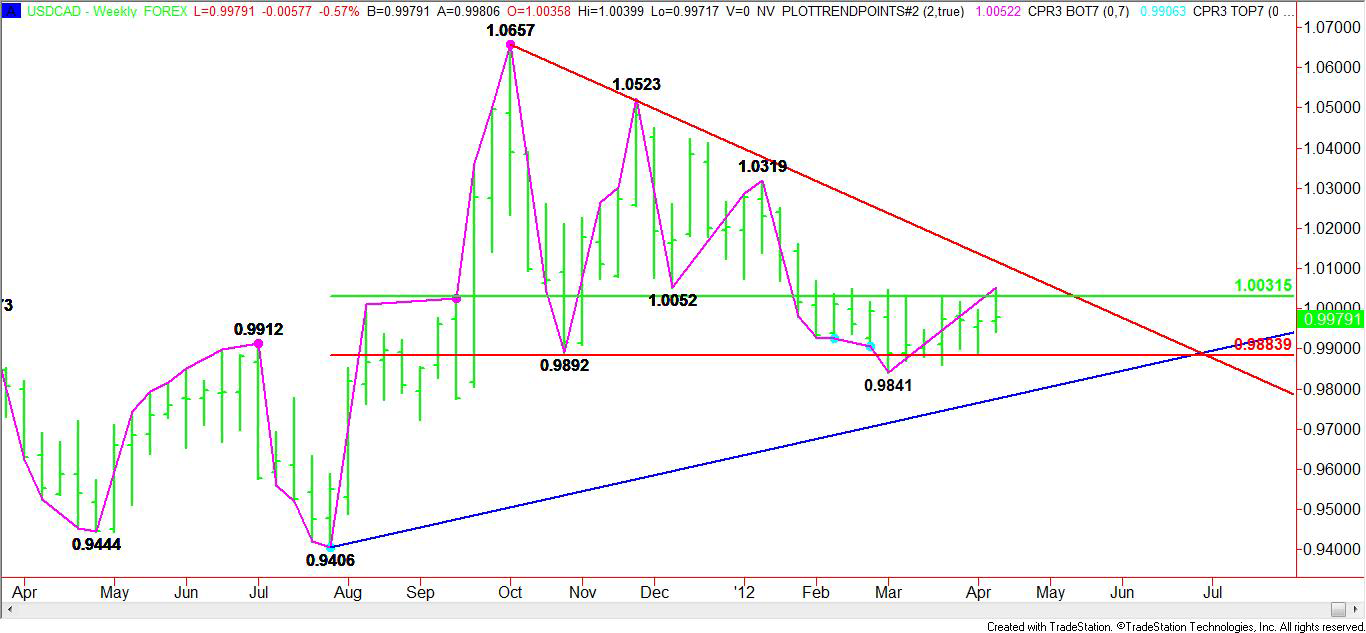 USD/CAD" title="USD/CAD" width="1366" height="633">
This conclusion is being supported by the triangle chart pattern that has been formed by a pair of Gann angles. From the bottom at .9406, a 37-trading day uptrending Gann angle is at .9776 this week. A 27-trading day downtrending Gann angle from the 1.0657 top comes in at 1.0117. These two angles form the support and resistance lines of the triangle chart pattern.
A triangle chart pattern is a non-trending pattern. The fact that the USD/CAD currency pair is consolidating or moving sideways inside of the triangle makes it a non-trending pattern. This action is compressing the price action which often indicates impending volatility. Adding to the price compression is tight trading ranges being created by the 50% and 61.8% retracement zone.
As the market moves through the triangle, prices could compress even further until the USD/CAD reaches the apex of the triangle. From the chart, you can see that the apex crosses the Fibonacci level near .9884 sometime in late June or early July. Based on this assessment, the U.S. Dollar/Canadian Dollar could remain rangebound for a few more months.
Traders often get agitated while a market is consolidating, but there is nothing that can be done at this time as long as the Bank of Canada and the Fed continue to give mixed signals. That is unless you like to trade ranges until a breakout occurs.
Obviously, the USD/CAD can break out at anytime before reaching the apex, but it seems to be on a clear path to remain inside the triangle until time is up. Around the middle of May, the downtrending Gann angle or upper resistance line of the triangle crosses the 50% level at 1.0031. This marks a time and price area where under the right conditions, the USD/CAD can breakout to the upside. If this breakout doesn’t occur, then the currency pair is destined to remain inside the triangle until the chart pattern is completed in late June or early July.
From a fundamental standpoint, until the Bank of Canada decides to begin raising interest rates or the U.S. Federal Reserve makes it clear that interest rates will remain low until 2014; the USD/CAD will remain rangebound. Next week the Bank of Canada releases its monetary policy report. This decision could move the market. So while a triangle pattern can cause a trader to look elsewhere for action, it should be reiterated that this chart pattern often acts as a transition between sideways to volatile trading. Traders should keep an eye on this currency pair because it may be setting up for a strong move.
Patience is the key to trading the USD/CAD at this time.
- English (UK)
- English (India)
- English (Canada)
- English (Australia)
- English (South Africa)
- English (Philippines)
- English (Nigeria)
- Deutsch
- Español (España)
- Español (México)
- Français
- Italiano
- Nederlands
- Português (Portugal)
- Polski
- Português (Brasil)
- Русский
- Türkçe
- العربية
- Ελληνικά
- Svenska
- Suomi
- עברית
- 日本語
- 한국어
- 简体中文
- 繁體中文
- Bahasa Indonesia
- Bahasa Melayu
- ไทย
- Tiếng Việt
- हिंदी
For USD/CAD Traders Patience Is The Key
Published 04/15/2012, 02:30 AM
Updated 05/14/2017, 06:45 AM
For USD/CAD Traders Patience Is The Key
Latest comments
Loading next article…
Install Our App
Risk Disclosure: Trading in financial instruments and/or cryptocurrencies involves high risks including the risk of losing some, or all, of your investment amount, and may not be suitable for all investors. Prices of cryptocurrencies are extremely volatile and may be affected by external factors such as financial, regulatory or political events. Trading on margin increases the financial risks.
Before deciding to trade in financial instrument or cryptocurrencies you should be fully informed of the risks and costs associated with trading the financial markets, carefully consider your investment objectives, level of experience, and risk appetite, and seek professional advice where needed.
Fusion Media would like to remind you that the data contained in this website is not necessarily real-time nor accurate. The data and prices on the website are not necessarily provided by any market or exchange, but may be provided by market makers, and so prices may not be accurate and may differ from the actual price at any given market, meaning prices are indicative and not appropriate for trading purposes. Fusion Media and any provider of the data contained in this website will not accept liability for any loss or damage as a result of your trading, or your reliance on the information contained within this website.
It is prohibited to use, store, reproduce, display, modify, transmit or distribute the data contained in this website without the explicit prior written permission of Fusion Media and/or the data provider. All intellectual property rights are reserved by the providers and/or the exchange providing the data contained in this website.
Fusion Media may be compensated by the advertisers that appear on the website, based on your interaction with the advertisements or advertisers.
© 2007-2024 - Fusion Media Limited. All Rights Reserved.