The Fed’s decision to hold rates steady yesterday certainly has unnerved a number of investors. The rate decision itself, whether to hike or not was not going to be the issue, but what Ms. Yellen and company would say would have the biggest impact. The Fed needed to be precise and very clear, their street credibility was on the line, but a “dovish bias” was not on many traders dance cards.
Nevertheless, yesterday’s statement and accompanying projections contained precisely that. Despite acknowledging continued improvement in the domestic labor market, unemployment at +5.1%, the Fed emphasized global uncertainty, the slowdown in China, the strength of USD, and inflation “nowhere near” target.

Dovish Bias Undertones
Economic projections saw cuts to U.S growth and the PCE inflation outlook, while the “dot-chart” saw the median rate for 2016 and 2017 both reduced.
U.S GDP midpoint for this year was not surprisingly improved to +2.15% from +1.9%, but 2016 was lowered from +2.55% to +2.4% while 2017 was readjusted to +2.2%, and 2018 came in at +2.0%. The long-run real GDP estimate (potential growth) was also lowered to +2.0% from 2.15%.
The midpoint for headline inflation in 2015 was lowered to +0.4% from +0.7%, while next year came down a bit to +1.65% from +1.75%, and 2017 was little changed. The core-PCE projections were unchanged for this year while 2016 was lowered to +1.65%.
The median “dot” this year shows only one hike versus two in June. The revision is felt throughout following years as well, with the median long-run dot also coming down by -25bps. The median funds rate in 2015 is now +0.375% vs. +0.625% in June – only 13 members think the Fed should raise rates this year vs. 15 previously. The 2016 median dot fell from +1.625% to +1.375%, but still implies four hikes next year. The 2017 median dot fell from +2.875% to 2.625%, implying five hikes. The new median dot for 2018 is +3.375% and the long-run dot is +3.50% vs. +3.75% in June.

Despite investors delayed reaction, the Fed’s dovish bias has risk aversion trading gaining the upper hand on global growth concerns to close out this week.
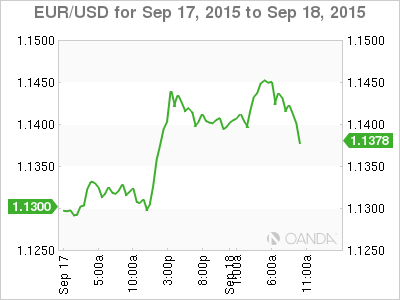
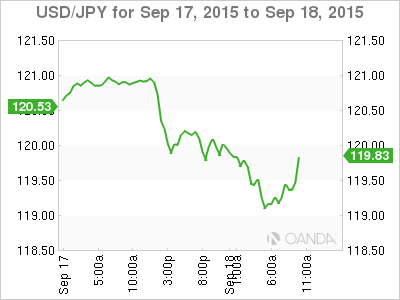
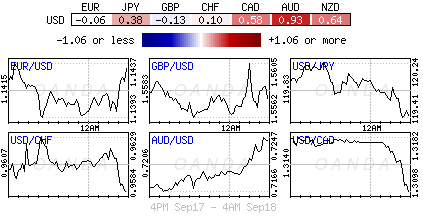
The mighty USD is softer across the board, and trading at new multi-week lows against the G10 currency pack (€1.1443, £1.5625, ¥119.00 and CAD$1.3075) as dealers and investors figure out if there are required to navigate more “speed bumps” ahead. The dollar’s demise has brought some welcome relief to emerging market currencies (THB $36.53 biggest two-day gain in two years). The global growth question mark is again pressuring short-term U.S yields, equities and commodity prices.
One and Done
Investors can expect volatility to remain heightened for the foreseeable future. Most dealers would have preferred the Fed to have hiked yesterday and get that ‘token’ rate hike out of the way. Not so, capital markets now have to go through the whole exercise again next month – Fed speeches, more data to analyze and now the international component. With the medium dot plot projection still suggesting one rate hike for this year, the odds now favor an October hike despite the ‘no’ Fed press conference. Illiquid conditions in December would not be a prudent move by the Fed from a financial stability perspective.

