Even as a proponent of the Federal Reserve’s strategy of using an arsenal of unusual monetary policy weapons to keep the financial system from falling off the cliff that it deserved to fall from back in 2008 and 2009, it’s pretty annoying to see how distorted many charts have become as a result of reinflating words and actions versus what would be a recessionary and deflationary reality.
This distortion shows in the risk-on and risk-off sideways trends in pretty much all risk asset charts, but it is particularly gross in the charts of the financials and something that cannot be adequately shown by the chart of the Financial Select Sector SPDR (XLF) alone, and thus requires a small version of the charting bonanzas of the old days circa winter and spring 2011 via Commodity Complex to Collapse, Cruel Correction to Come? and Are the Financials Folding?
Due to the volatile whipsaws created by the Fed’s aggressive monetary policy actions and the spaces of time that follow when investors are faced by the uncertainties of whether the economy can make it without the Fed, it is not entirely clear that the financials are folding currently, but it seems very likely that the financials may or may not move just a little bit higher before suffering from a significant bearish blow.
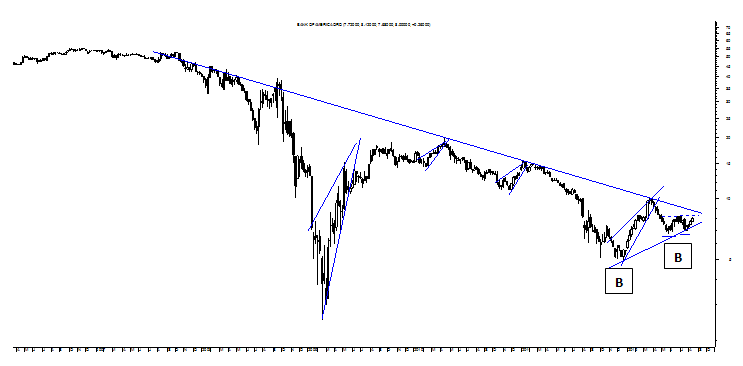
Let’s start with the weekly chart of Bank of America (BAC) that is showing the degree of investor confusion out there about the fate of the big banks with a real battle showing between the bulls and the bears.
Currently, the bulls are trying to charge higher on the tiny Double Bottom tucked away to the right and a pattern that reconfirms at $8.22 for a target of $9.73 and a level that would reverse BAC’s long-term downtrend by putting shares above that descending trendline while a potential move above $10.10 would confirm the major Double Bottom with a target of about $15. Fighting for the bears, though, is a Rising Wedge born of last year’s Operation Twist and LTRO rally that is confirmed to take BAC back down below $5 while a Rising Wedge from 2009 could still come after its full target of $2.53 and a level that would be consistent with a real downside break from the Symmetrical Triangle shown.
What side will win this truly drawn out bull and bear fight that exemplifies central bank distortions in the equity markets? It really is not clear from looking at the technicals with the bullish forces representing “help” from the central banks while the bearish forces represent investor uncertainty about how all of this will end and the best thing that can be done here is to practice truly reactive rather than predictive charting by watching levels.
Should BAC climb above resistance at $8.80 to begin to reverse that long-term downtrend, there is a good chance BAC may climb to $15 in the months ahead. Should BAC drop back below its 200 DMA that is at $7.42 currently, attention goes to the Rising Wedge patterns that are consistent with BAC’s still-holding long-term downtrend.
Shares of Morgan Stanley (MS) are trading in a very similar manner with the entirety of the chart presenting nearly as a multi-year bearish Descending Triangle that would support BAC’s bearish aspects, but it is Goldman Sachs (GS) and the so-far untouchable Wells Fargo (WFC) that better support the medium- to long-term bearish case for the big banks
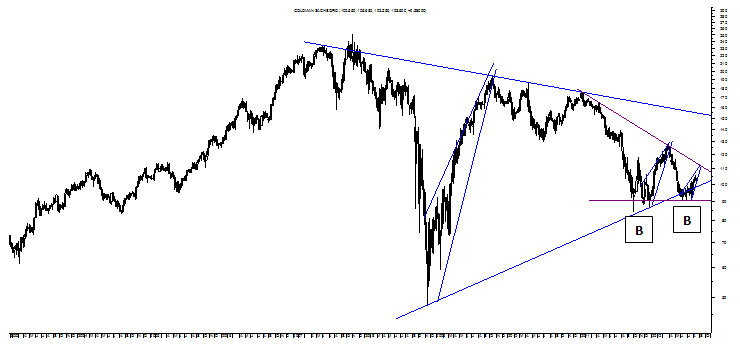
In looking at the long-term weekly chart of Goldman Sachs below, it also shows the tension between a Double Bottom that would reverse its long-term downtrend and a still-fulfilling Rising Wedge born in 2009.
If the bulls win here, Goldman Sachs will climb back toward $175 on the Double Bottom that confirms at $129, but the bears are fighting against it with a minor Rising Wedge that may cause the Double Bottom to fail to its target of $90 with the major Rising Wedge slowing working GS down in a very symmetrical fashion toward its target of $47.
But another aspect that shows as well even though it is a bit camouflaged in all of the sideways trading is a bearish Descending Triangle in purple and a pattern that carries a similar sub-$50 target as the major Rising Wedge.
It supports the aforementioned symmetry as well and could take GS up toward $113 before knocking it down below $90 and another reason to think the bears may win here in Goldman Sachs and something that casts BAC’s chart in a more bearish light too.
Even so, levels will be the real tell here and broadly speaking those levels of support and resistance again are at $84 and $129 with a breach on either side determining whether GS rallies significantly higher or falls back in the gutter with a relatively small and unmarked Descending Triangle supporting the steep decline.
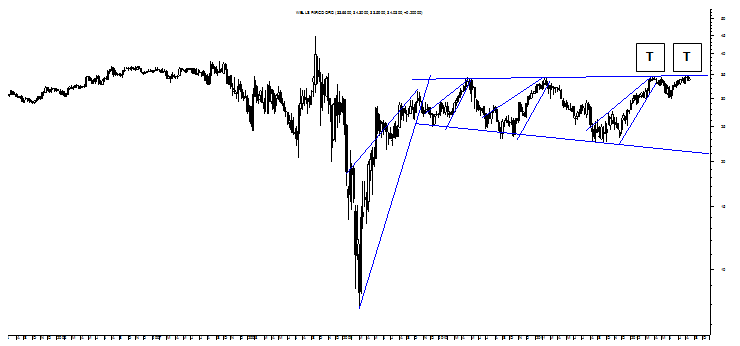
Turning now to Wells Fargo and the biggest component of the XLF, it has hit up against resistance yet again but this time in what appears to be a Double Top.
Supporting WFC’s Double Top that confirms at $29.80 for a target of $24.80 is its most recent Rising Wedge that carries a slightly lower target at about $23 while it is the bottom of WFC’s bearish Broadening Formation that suggests shares of WFC may fall close to $21 within the next few quarters and this scenario should be taken very seriously unless WFC clears long-term resistance convincingly.
Should WFC finally give way to the downside in a more significant fashion, it would suggest that the other charts reviewed along with those of Citigroup (C), JP Morgan (JPM) and Morgan Stanley will also suffer from significant declines and something that suggests fundamental uncertainties will outweigh Federal Reserve liquidity or pave the clear path to a round of quantitative easing that may prove to be more effective in what would be a closer to deflationary environment.
What would be a truly deflated environment, presumably, is one that would cause WFC’s major Rising Wedge to confirm at $20 for its target of about $8 and a decline that would a truly precipitous fall for Wells Fargo and a possibility that should not be ruled out with some things truly taking longer and going further than could ever be imagined initially.
Overall, then, it seems that the financials are getting funky but probably ahead of what may be a significant fold to the downside.
Sam’s Stash, Gold and the S&P
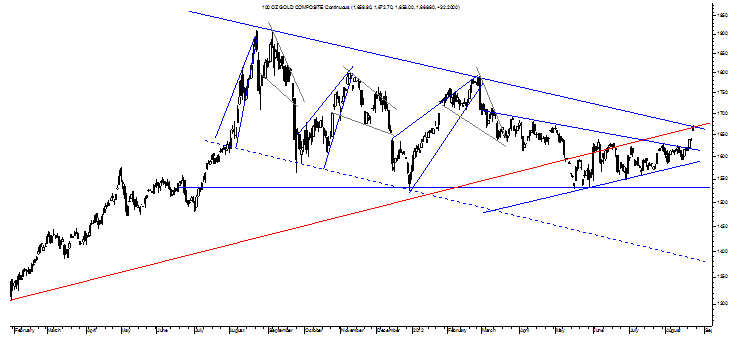
Here’s a good chart showing the degree of uncertainty out there on the part of investors about what’s next in the ongoing bull and bear battle between the Fed and the fundamentals. 
Talk about a trendline touch for gold, but one that would appear to be bearish in nature unless gold can take out resistance offered by the major Descending Triangle above and a pattern that could take gold toward its conservative upside target of $2,200 per ounce but is probably more prone to dropping gold down toward this pattern’s proper downside target at $1,136 per ounce.
Should gold drop in such a precipitous manner on a failure to take out resistance and something that would push gold back into the body of that massive pattern, it would speak to a deflationary environment of some sort as risk assets trade off and something that may be augured to some degree by the financials getting funky.
- English (UK)
- English (India)
- English (Canada)
- English (Australia)
- English (South Africa)
- English (Philippines)
- English (Nigeria)
- Deutsch
- Español (España)
- Español (México)
- Français
- Italiano
- Nederlands
- Português (Portugal)
- Polski
- Português (Brasil)
- Русский
- Türkçe
- العربية
- Ελληνικά
- Svenska
- Suomi
- עברית
- 日本語
- 한국어
- 简体中文
- 繁體中文
- Bahasa Indonesia
- Bahasa Melayu
- ไทย
- Tiếng Việt
- हिंदी
Financials Are Getting Funky
Published 08/28/2012, 01:34 AM
Updated 07/09/2023, 06:31 AM
Financials Are Getting Funky
3rd party Ad. Not an offer or recommendation by Investing.com. See disclosure here or
remove ads
.
Latest comments
The FED if causes confusion..., I think that YOU with your explanation confuses more to people. Because it seems that YOU WISH the markets to go down, but you don't have a GOOD explanation to arrive to that conclusion, so buy adding confusion you are trying just to introduce FEAR in order to get your goal...
BANK OF AMERICA (BAC) has its medium term momentum to the upside, but has to hold over 7,60 to mantain this situation. Its Near Term depends if it moves over 8,16 to get more energy. But its Long term momentum seems to me, that in any case moves lower, would be the last correction because NEXT LEG UP ON MARKETS WOULD BE LEAD BY BANKS.
My best,
Pattie
Install Our App
Risk Disclosure: Trading in financial instruments and/or cryptocurrencies involves high risks including the risk of losing some, or all, of your investment amount, and may not be suitable for all investors. Prices of cryptocurrencies are extremely volatile and may be affected by external factors such as financial, regulatory or political events. Trading on margin increases the financial risks.
Before deciding to trade in financial instrument or cryptocurrencies you should be fully informed of the risks and costs associated with trading the financial markets, carefully consider your investment objectives, level of experience, and risk appetite, and seek professional advice where needed.
Fusion Media would like to remind you that the data contained in this website is not necessarily real-time nor accurate. The data and prices on the website are not necessarily provided by any market or exchange, but may be provided by market makers, and so prices may not be accurate and may differ from the actual price at any given market, meaning prices are indicative and not appropriate for trading purposes. Fusion Media and any provider of the data contained in this website will not accept liability for any loss or damage as a result of your trading, or your reliance on the information contained within this website.
It is prohibited to use, store, reproduce, display, modify, transmit or distribute the data contained in this website without the explicit prior written permission of Fusion Media and/or the data provider. All intellectual property rights are reserved by the providers and/or the exchange providing the data contained in this website.
Fusion Media may be compensated by the advertisers that appear on the website, based on your interaction with the advertisements or advertisers.
© 2007-2024 - Fusion Media Limited. All Rights Reserved.
