
Our research team warned of a peak in the Financial Sector ETF on June 10, with this article.
It was important to understand the technical setup that existed at that time and what the Fibonacci Price Modelling system was showing then. There was very clear support near $23 that was highlighted by the Fibonacci Price Modelling System and we were very clear in our future price predictions within that article...
“The $27 price peak sets up directly between our two Fibonacci Daily upside price target (Peak) levels. We believe this setup is a very strong indication that a move to below $23 may be setting up
over the next 30+ days. The Q2 data may very well push investors to re-evaluate the potential for the Financial sector if delinquencies and at-risk borrowers continue to default in greater numbers.“
The timing of our original article could not have been better for skilled technical traders. Since that June 10, article posted, the XLF price has fallen almost exactly to $23 (-10.15%).
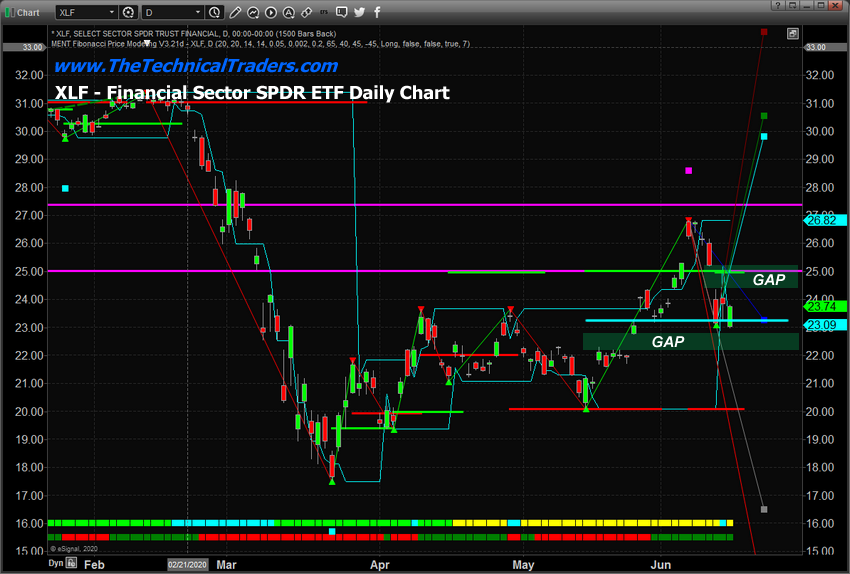
Currently, the FLX price is recovering just above the price gap that will act as the next “window” for the price to attempt to fill. Skilled technical traders should watch the Breakdown Gap (NYSE:GPS) that setup
between June 10 and June 11 as an upper window of resistance (between $25.20 and $24.35). It is very likely that the XLF price may attempt to breach or fill this gap window before initiating another
downside price move targeting levels below $22.
Daily XLF Chart
It is our opinion that should sudden price weakness drive price levels lower, away from the upper gap range, then weakness in the financial sector could create a series of new lower price gaps as XLF price
levels attempt to gap downward – through $22, then $20, then ultimately the $18 to $19 price level.
This Weekly XLF chart highlights the longer-term Fibonacci Price Modeling System's expectations showing the current downside price move has broken below the Bearish Fibonacci Price Trigger Level near $24.87. At this point, the next lower support level is near $22.10 – just below the lower gap level.
It is our opinion that the Financial Sector ETF will attempt to break below $22 in the near future and may attempt to fall to levels near or below $20. The current support in the market from the $23 level may prompt a move into the upper gap level before the next downside move begins – although we feel that is not likely to happen.
Weekly XLF Chart

Watch for a breakdown in price trading below $23.50 as an indication that weakness has prompted price to trade below the recent “Belt-Line” price level. We believe a new close below $23.50 would be a good indication that the lower gap is about to be filled and a deeper price move may take place targeting $20 to $21.
As the Q2 data starts to hit the news wires over the next 4+ weeks, we believe risks to the financial system will become very evident as a result of the COVID-19 shutdown. Be prepared for increased
volatility in almost all sectors and the very real potential for a retest of recent low price levels.