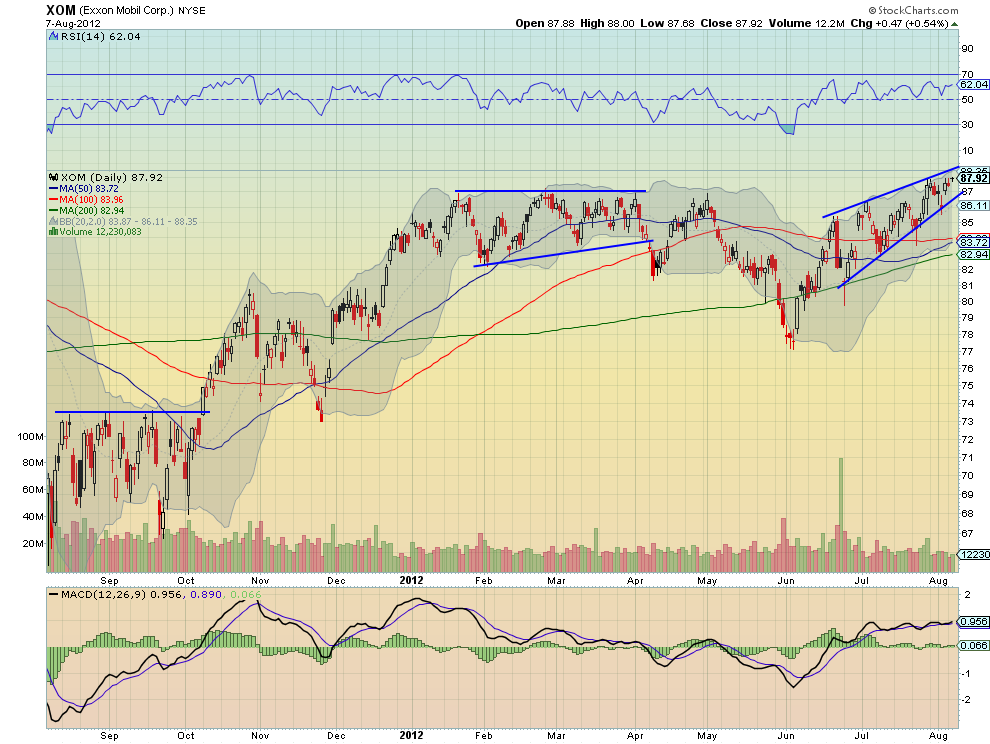
Big Oil has been moving higher with the market lately. These mega cap stocks can be like battleships to move so when they do break out it is something to notice. Exxon Mobil (XOM) is doing that now. Take a look. The daily chart below shows a rising wedge making a new high over the resistance area at 57 from February and March. The Relative Strength Index (RSI) is bullish and rising and the Moving Average Convergence Divergence indicator (MACD) is positive.
Exxon Mobile (XOM) Daily
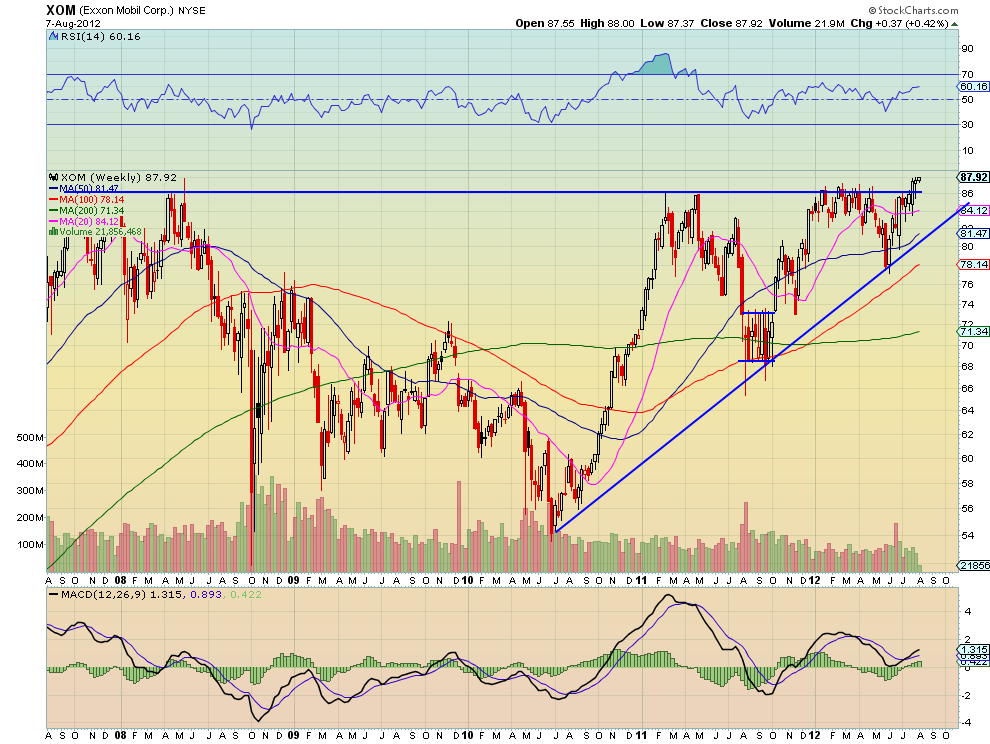
Both support further upside. Some might think that it is best to wait for the wedge break to play the stock. A break higher is a buy, a break lower is a sell. 110 or higher perhaps. But if you look a bit longer, the scale of the weekly chart is very promising. It shows a confirmation of a breakout of a 4-year ascending triangle with a target of at least 118. The RSI and MACD on this time frame are equally supportive of a move higher.
Exxon Mobile (XOM) Weekly
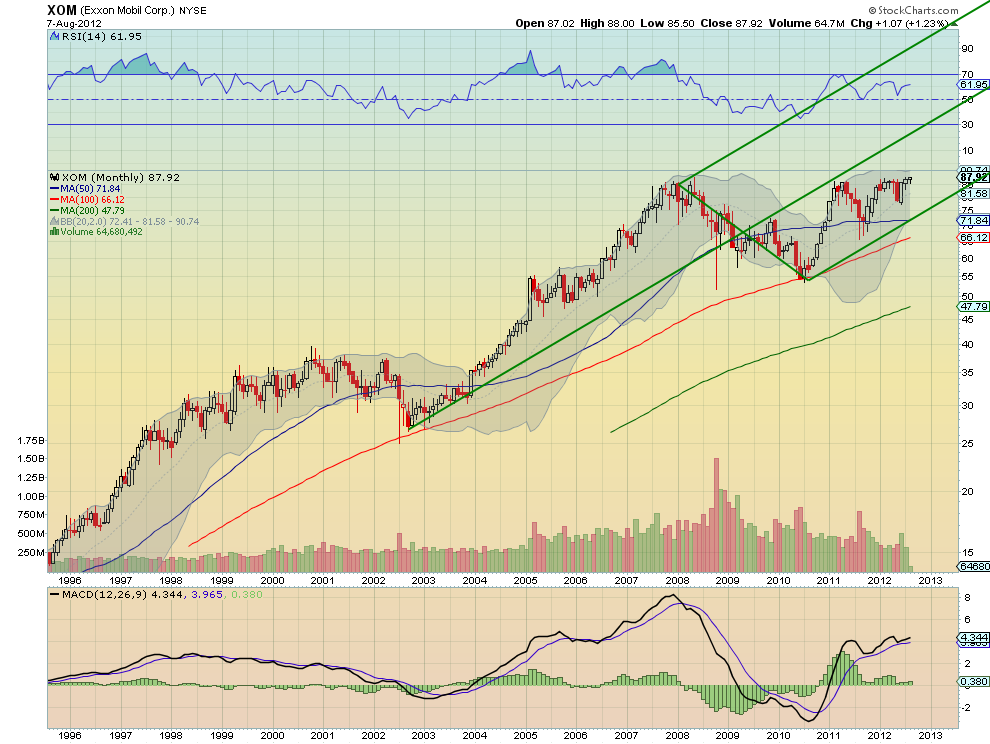
And rolling out to the Monthly chart shows a triple top breakout and movement higher between the Lower Median and Median Lines of the Andrew’s pitchfork. Finally the 3-box reversal Point and Figure chart shows a price objective of 99. Whether it is 99 or 110 or 118, they are all big moves from here. The Battleship is steaming.
Exxon Mobile (XOM) Monthly
Disclaimer: The information in this blog post represents my own opinions and does not contain a recommendation for any particular security or investment. I or my affiliates may hold positions or other interests in securities mentioned in the Blog, please see my Disclaimer page for my full disclaimer.
Original post
- English (UK)
- English (India)
- English (Canada)
- English (Australia)
- English (South Africa)
- English (Philippines)
- English (Nigeria)
- Deutsch
- Español (España)
- Español (México)
- Français
- Italiano
- Nederlands
- Português (Portugal)
- Polski
- Português (Brasil)
- Русский
- Türkçe
- العربية
- Ελληνικά
- Svenska
- Suomi
- עברית
- 日本語
- 한국어
- 简体中文
- 繁體中文
- Bahasa Indonesia
- Bahasa Melayu
- ไทย
- Tiếng Việt
- हिंदी
Exxon Mobil Set To Become A $500 Billion Company
Published 08/08/2012, 03:09 AM
Updated 05/14/2017, 06:45 AM
Exxon Mobil Set To Become A $500 Billion Company
3rd party Ad. Not an offer or recommendation by Investing.com. See disclosure here or
remove ads
.
Latest comments
Install Our App
Risk Disclosure: Trading in financial instruments and/or cryptocurrencies involves high risks including the risk of losing some, or all, of your investment amount, and may not be suitable for all investors. Prices of cryptocurrencies are extremely volatile and may be affected by external factors such as financial, regulatory or political events. Trading on margin increases the financial risks.
Before deciding to trade in financial instrument or cryptocurrencies you should be fully informed of the risks and costs associated with trading the financial markets, carefully consider your investment objectives, level of experience, and risk appetite, and seek professional advice where needed.
Fusion Media would like to remind you that the data contained in this website is not necessarily real-time nor accurate. The data and prices on the website are not necessarily provided by any market or exchange, but may be provided by market makers, and so prices may not be accurate and may differ from the actual price at any given market, meaning prices are indicative and not appropriate for trading purposes. Fusion Media and any provider of the data contained in this website will not accept liability for any loss or damage as a result of your trading, or your reliance on the information contained within this website.
It is prohibited to use, store, reproduce, display, modify, transmit or distribute the data contained in this website without the explicit prior written permission of Fusion Media and/or the data provider. All intellectual property rights are reserved by the providers and/or the exchange providing the data contained in this website.
Fusion Media may be compensated by the advertisers that appear on the website, based on your interaction with the advertisements or advertisers.
© 2007-2024 - Fusion Media Limited. All Rights Reserved.
