Get 40% Off
💰 Buffett reveals a $6.7B stake in Chubb. Copy the full portfolio for FREE with InvestingPro’s Stock Ideas toolCopy Portfolios

Expect A Slow January?

Published 01/02/2015, 01:01 AM
Updated 07/09/2023, 06:31 AM
NDX
-
DX
-
ESM24
-
CL
-
UUP
-
TRCCRB
-

With the S&P 500 losing support so early in a new daily cycle on Friday, I’m afraid we’re probably set up for a choppy market in January.
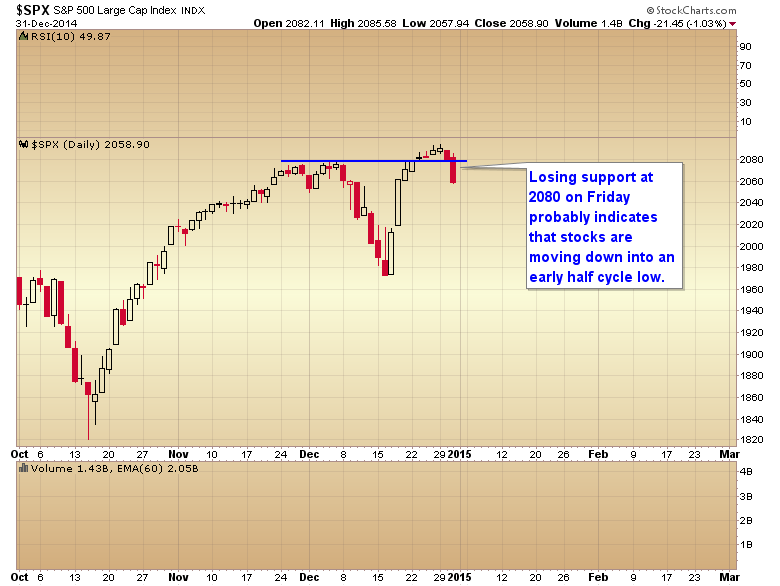
SPX Daily From October 2014 To Present

I had my doubts as to whether the market could break through 2100 on the first try, and Friday’s move has probably confirmed that it is not going to. With the market starting down into a half cycle low, along with an upcoming earnings season, ECB's decision on QE (Jan. 22), and Greek vote (Jan. 25), I expect the stage is probably set for the market to chop sideways underneath 2100 for most of January before a brief breakout late in the month.
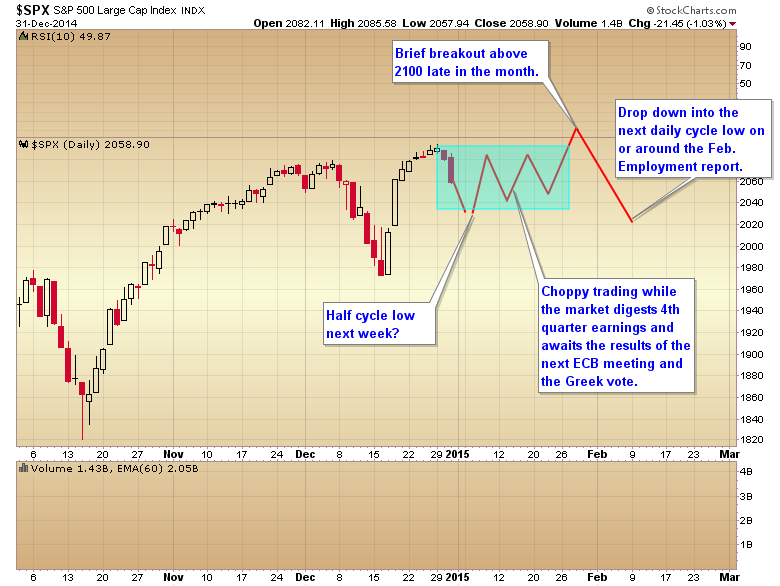
SPX Prediction Chart For January 2015

As a matter of fact I suspect the entire first quarter is likely to be difficult as I expect the rally out of the early February daily cycle low (diagrammed in the chart above) will probably form as a left translated cycle and then drop down into a sharp intermediate correction. Why? Because I expect Yellen will set a date for the first rate increase during the February Humphrey Hawkins address. The market will rebel by falling hard into a deep intermediate degree correction. (Don’t get me wrong, I’m not calling a final top, I still think there is little chance the market tops before the Nasdaq reaches 5100.)
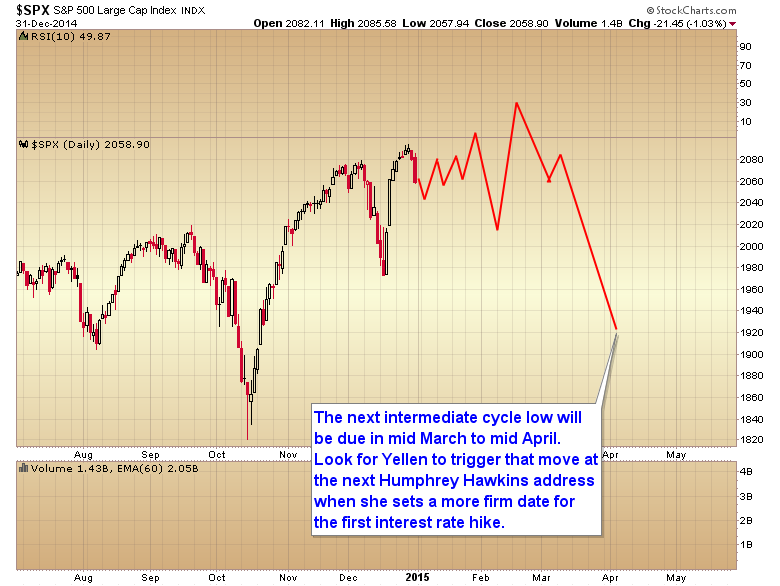
SPX Prediction Chart For January 2015 To April 2015

If the move is deep enough it might even trigger QE4 and that could give us a final parabolic move to top off this QE driven bull market.

3rd party Ad. Not an offer or recommendation by Investing.com. See disclosure here or remove ads .

So if stocks are going to be stuck in a volatile trendless consolidation for a while then where can one make money you ask?

Day traders may do OK in the weeks and months ahead, but I think the most likely place for at least a tradable trend may come in the commodity markets. They are way overdue for a counter trend bounce, especially oil. Just don’t get too greedy as it’s still too early for the CRB to form a final 3 year cycle low, so this will probably be short lived. But we could see commodities rally for a month or two before resuming their bear market trend into a final bottom maybe later this summer or next fall.
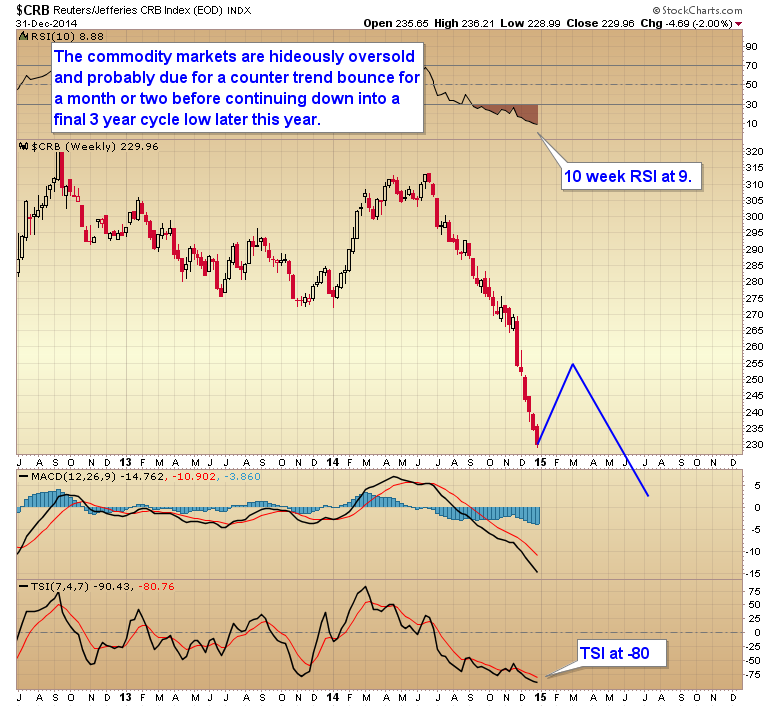
CRB Weekly Price Chart  From January 2012-To Present W/Prediction

This would square up with the dollar moving down into an intermediate correction as it is also way overdue to take a breather.
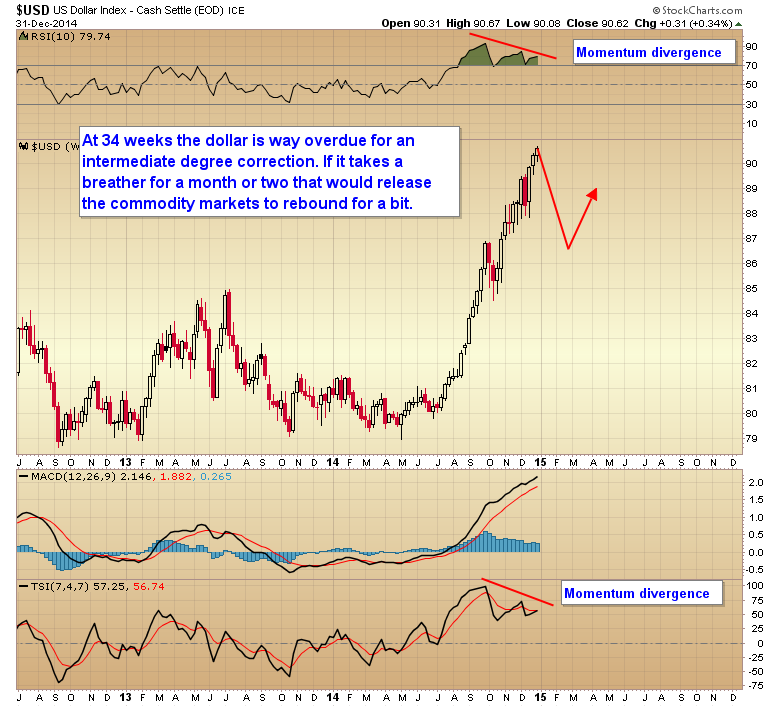
USD Weekly Chart From January 2012-To Present With Prediction 2015

The key is oil. Oil has to break free from OPEC forces trying to push it down. In order to do that it’s going to need some help from the dollar. So watch the dollar for a sharp break to the downside in the days ahead. A large volume spike on the (NYSE:UUP) on a down day would also be a clue that the intermediate tides may be ready to turn… at least for a month or two.

Latest comments

Risk Disclosure: Trading in financial instruments and/or cryptocurrencies involves high risks including the risk of losing some, or all, of your investment amount, and may not be suitable for all investors. Prices of cryptocurrencies are extremely volatile and may be affected by external factors such as financial, regulatory or political events. Trading on margin increases the financial risks.
Before deciding to trade in financial instrument or cryptocurrencies you should be fully informed of the risks and costs associated with trading the financial markets, carefully consider your investment objectives, level of experience, and risk appetite, and seek professional advice where needed.
Fusion Media would like to remind you that the data contained in this website is not necessarily real-time nor accurate. The data and prices on the website are not necessarily provided by any market or exchange, but may be provided by market makers, and so prices may not be accurate and may differ from the actual price at any given market, meaning prices are indicative and not appropriate for trading purposes. Fusion Media and any provider of the data contained in this website will not accept liability for any loss or damage as a result of your trading, or your reliance on the information contained within this website.
It is prohibited to use, store, reproduce, display, modify, transmit or distribute the data contained in this website without the explicit prior written permission of Fusion Media and/or the data provider. All intellectual property rights are reserved by the providers and/or the exchange providing the data contained in this website.
Fusion Media may be compensated by the advertisers that appear on the website, based on your interaction with the advertisements or advertisers.
© 2007-2024 - Fusion Media Limited. All Rights Reserved.