Get 40% Off
🎁 Free Gift Friday: Copy Legendary Investors' Portfolios in One ClickCopy for Free

Expanding Wedge May Prompt Big Price Correction – Could A Big Top Be Setting Up?

Published 08/28/2020, 10:31 AM
Updated 07/09/2023, 06:31 AM

Research Highlights:

  • The Monthly S&P 500 E-Mini Futures chart is revealing an expanding wedge pattern that has been setting up since January-February 2018.
  • The VIX has set up a base and begun to move moderately higher over the past 7+ days – above the 20.00 point level and above the GAP created by the initial COVID-19 selloff.
  • Our Custom Volatility Index chart warns of a "bull trap" set up, and we may see an 11% to 15% (or more) sell-off in the U.S. and global markets if the Custom Volatility Index collapses below 10 over the next few weeks.
  • Are These Technical Setups Warning That A Market Top Is Forming?

I want to bring this large expanding wedge pattern to your attention as my research team and I watch the markets continue to push to new all-time highs. This is a follow on to our research from our Special Alert report warning of Head-and-Shoulder patterns in some of our custom charts. We know it may sound a bit alarming to be the one to bring up a potentially devastating Bearish technical pattern at this time, but as technical traders, we must stay aware of risks even if they may not materialize. Trading is a process where we take measured risks in an attempt to generate profits over time. Risk becomes a very big issue if it is not properly managed – just as trading becomes very difficult if one doesn't learn to take profits in good trades.

Long-Term Expanding Wedge Risks – Be Warned

3rd party Ad. Not an offer or recommendation by Investing.com. See disclosure here or remove ads .

The Monthly S&P500 E-Mini Futures chart below highlights the expanding wedge pattern that is setting up over the past 26+ months (starting in Jan/Feb 2018). The U.S. stock market has rallied after the COVID-19 virus event to push to new all-time highs – rising above the upper wedge channel. Our researchers believe this pattern may be warning of a potential for a very deep price correction – possibly 11% to 18% or more.
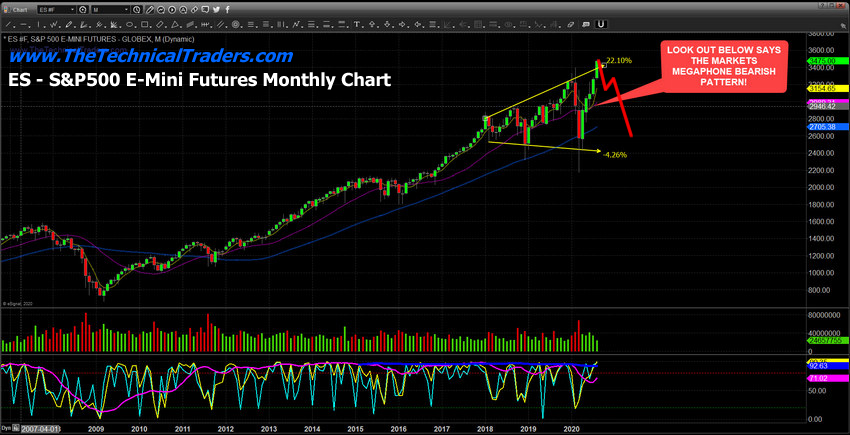
S&P 500 E-Mini Futures Monthly Chart.

There are a number of other technical setups that are starting to confirm a potential breakdown. The following Weekly Custom Volatility Index chart shows some very interesting price action this week. First, we want you to pay attention to the Standard Deviation Channels that are drawn on this chart. There are two of them. The longer-term Standard Deviation Channel is sloping higher, while the shorter-term Channel is sloping downward. We want you to focus on the downward sloping Standard Deviation Channel and how price has risen to the upper 1x Standard Deviation range (the BLUE LINE) and stalled this week (while the markets continue to push to new all-time highs).
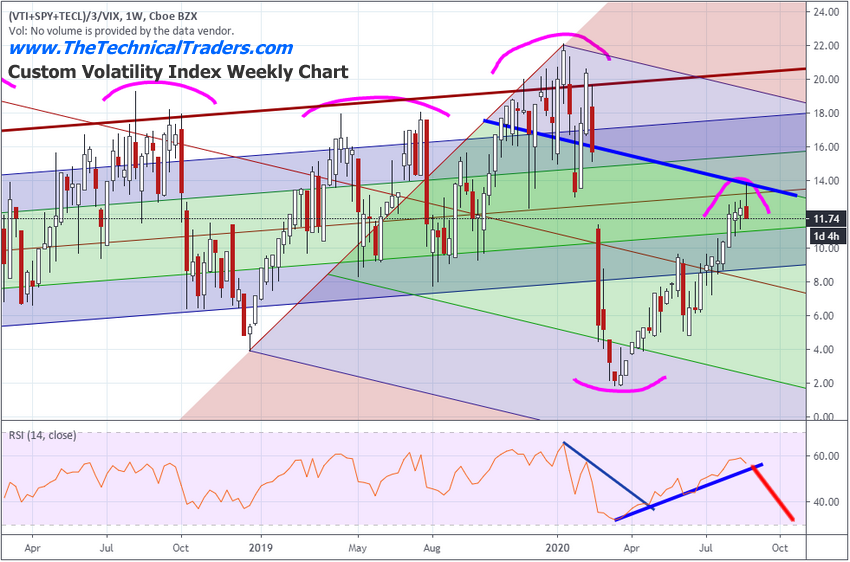
Weekly Custom Volatility Index.

This setup on the Custom Volatility Index chart has our research team concerned that these new price highs may actually be setting up a “bull trap” – getting retail and institutional traders to chase the rally, then collapsing into a deep and aggressive downward price trend. If the Custom Volatility Index collapses below 10 over the next few weeks, it would indicate a very strong selling mode has begun where we may see a 11% to 15% (or more) sell off in the U.S. and global markets.

3rd party Ad. Not an offer or recommendation by Investing.com. See disclosure here or remove ads .

Now, pay attention to the long-term Standard Deviation Channel on this next chart. Notice how the current Volatility Index price level has just recently moved above the mid-point of the longer-term Standard Deviation Channel (the middle of the Green area within the channel). This “touch-n-blowoff” type of price action suggests price have returned to the mid-point of the longer-term price Std. Deviation range and run into strong resistance. If price is going to continue higher, we would expect this Custom Volatility Index to rally above the 14 level and continue to push higher. Right now, this moderate selloff within the Custom Volatility Index suggests a peak or top may be setting up in the markets – suckering in traders as the markets push to new highs on speculative trading in Technology and other sectors.

VIX Is Climbing

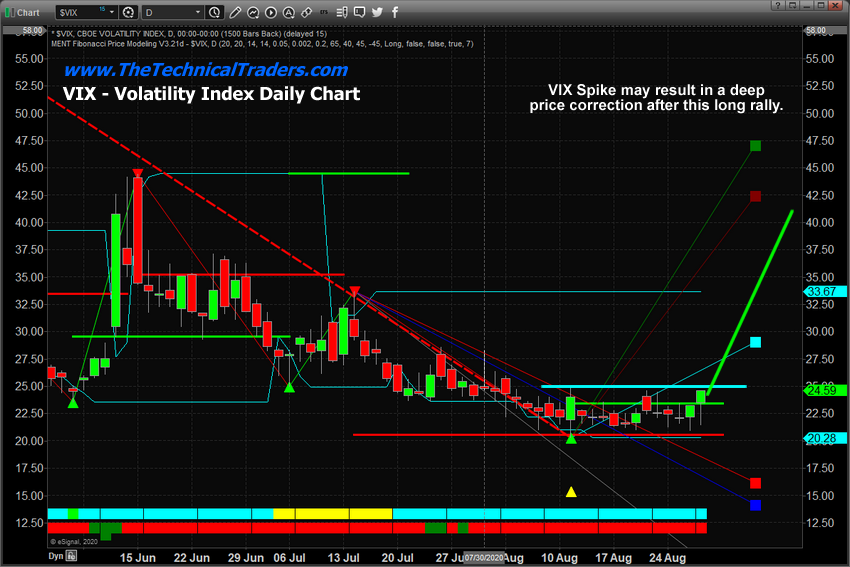
Lastly, the VIX has setup a base and begun to move moderately higher over the past 7+ days – above the 20.00 point level (above the gap created by the initial COVID-19 selloff). Our researchers believe the upward price moves in the VIX over the past few days suggest that fear is starting to rise again while the U.S. stock markets push to new all-time highs. This suggests that many traders are not comfortable with how the markets are pushing ever higher while economic data and forward concerns still persist. It may be that speculative capital has pushed the U.S. stock market back to new all-time highs while traders chase the Technology Bubble – while more seasoned traders watch and think “what are these people doing chasing these crazy trends?”
3rd party Ad. Not an offer or recommendation by Investing.com. See disclosure here or remove ads .

VIX Daily Chart.

Either way, a spike in the VIX above 25 to 30 would certainly spook the market after we have watched traders pour capital into these new all-time highs. And we believe the potential for the VIX to spike over the next 3+ weeks is substantial given the speed and tenacity of the upward price trend in the U.S. stock market recently.

The upside price rally has been impressive, but is also create a very real risk potential when traders pile into speculative bubbles/trends like this. We've been through things like this before in 1999 and in 2005~2007. Look at the size of that expanding wedge pattern on the monthly chart. Being on the wrong side of a 25% downside price correction is not a lot of fun. Be prepared and follow our research.

Latest comments

Embarrassing broken record.
US NO LEADERSHIP: Global coronavirus cases surpass 25 million as pandemic strains nations around the world: US the worst most contaminated country in the world now with: 6,141,731 total cases by far the worst in the world. Brazil is second with 3,846,965 and India is third with 3,566,555. (These numbers are updated minute by minute.) The U.S., Mexico and Brazil represent more than 40% of the global death toll, according to Johns Hopkins. US NO LEADERSHIP. Stock market at all-time-highs do not win elections.
I may write a better article than Chris. He may write another article “Time to collapse” after a couple of weeks making dozens of ATH.
we are not get trump right
The sad thing is that one day he will actually get lucky and make a correct call. please beware, he calls for a top every other week.
Chris don't put chart, show your portfolio performance since you shorted QQQ. I know you can only earn money publishing rubbish chart. Newbie alert this guy post all wrong stuff, market is in bull market stay invested fully
US NO LEADERSHIP: CORONAVIRUS HUGE INCREASE IN CASES: AUGUST 29: REPORT: United States (US) new cases: +10,639 and new deaths: +358 and now the total number of cases in the US is: 6,106,874 by far the most contaminated country in the world. NO LEADERSHIP. Stock market at all-time-highs do not win elections. Time to SELL this HUGE HISTORICAL STOCK MARKET BUBBLE.
like it or not, Chris is the only one willing to stick his neck out and make actual market predictions.
no one is bias against him. but the hard fact is he is always wrong !
After Trump is re-elected, perhaps mid-to late December, the market will substantially correct. If not, early Jan.
I think its also interesting to see we are making these new highs while volumes are noticeably lower.
Great point, and I’d add that the number of SPACs/IPOs is rapidly increasing, VXX is slowly rising and P/C is also up, all of which indicate market topping. Smart money is buying cheap portfolio insurance while volatility is still at pre-spike levels. Once the market corrects, insurance will get very expensive.
yes, wedge is no different from a down breakout, as that down leg is so big.
I was thinking we are do for a pull back come september but now after reading this article Im scratching my head, it really makes me think we are going higher. No one is as good as you really. Its amazing. Even your bullish article on natural gas called the top. Your gonna be right soon you have to be, you have been so wrong for so long on so many things no one is this good, you have to be right have to be one of these days its impossibe your the best contrarian indicator I have ever seen.
That wedge looks broken already
Never ever fight the Fed!low rates a even lower makes equities the only asset class option. Never short a market making new highs. Market is set up for significant bull upside. on the technicals don't overlook the huge cup and handle patterns now giving upside breakouts. The trend is your friend until it ends. The new industrial revolution is in technology with massive future growth potential and that is what is driving this market. The bears have been wrongly calling it's collapse since the gfc
Cup and handle is not a guarantee the market will go up forever.  At some point, the up wave has to cease.  Just saying
"The new industrial revolution is in technology with massive future growth potential and that is what is driving this market." we are not seeing the gunpowder invention exactly, just watch the p/e ratio of the fangs & funny, exact same lines I read from 1999, as u said the driver is the fed but I also read this line this week and I quote:  KAPLAN: MARKETS NEED TO UNDERSTAND HOW TO OPERATE WITHOUT FED SUPPORT.  So markets are up, good for me actually but I'm thinking intake some profits next week. 25% JIC. The election is heating up & china south sea conflict as well. Don't forget the virus is still there and the damage is long term. Markets are not the real economy. Be safe.
I’m wondering if the folks at DJIA are a contraindicator in dumping XOM, PFE. However, the % of tech in the DOW is actually DEcreasing due to AAPL’s split and the fact that DOW is price-weighted, not market cap-weighted.
Thank You, for a breath of Reality! Due to irresponsible central banks and politicians, attempting to play God with the economy by their perversion of a free market,. artificially inflated asset valuations are at historical highs! All while the debt bearing ,"real economy", is FAR from healthy! Any trader or investor chasing this mkt here will be in for a lot of pain! And this time when the music stops and the Feds low on bubble primer, reality will be sobering as it will likely have a very negative effect on a debt based synthetic standard of living so many have come to expect! Please don't think I'm a pessimist,..just a Realist!
...in a debt based system is allow debt to go unserviced! At what level does that occur?..good question! So you can rig the game,..while hoping for real game changing, value driving innovation,..before you reach the point of central bank default. (You can only cram so much MBS, small business loans, corporate paper down the rabbit hole!) Printing money is just punching numbers, what a central bank really does is devalue trust! In terms of mkts being "historically bullish", just remember the premise the whole systems based on..."in the long run, we're all dead"!
lmao next 10 year bull market?! Weve been in that already and we are just repeating 07 v recovery before massive dollar shortage because as jesse here so perfectly explained debt needs to be serviced. Money isnt created without fresh debt and the debt being created here is only to keep things afloat. Either it gets serviced and that ends up deflationary. Or it isnt able to be paid back and that ends up being deflationary. There is no money velocity here there is no infrastructure building. Its a bandaid on a wound that is infectected and the limb will need to be amputated shortly. The fed cant even control this anymore we are in for a wild economic depression worse than the gfc. The vix is already warning the downside pressure and the shorts might short squeeze us another leg up but the cookie will crumble.
There doesn’t have to be a basis for a huge drop. The bad datapoints that are being bought (read ignored) these days could be sold just as easily.
you know if people listened to your predictions since last month they lost 10% growth in nasdaq easily. imagine if they put tight stop loss and take all the gains and go back in when market falls. you guys have an incentive to give wrong information because if it is free information why would you even care about your readers, its not like we can come to your door and ask for refund
Chris. Thanks for the information. I appreciate the insights.
Lol that big great top has been forming for the last several months now... i am sure it is forming, it was technically work in progress 4 years ago too
It is nice seeing confidence and actual predictions. Most strategists give both sides and never actually take a stance to be actionable. Thanks man!
100% of his predictions are bearish for SPX. He is only bullish for PM and NG.
Risk Disclosure: Trading in financial instruments and/or cryptocurrencies involves high risks including the risk of losing some, or all, of your investment amount, and may not be suitable for all investors. Prices of cryptocurrencies are extremely volatile and may be affected by external factors such as financial, regulatory or political events. Trading on margin increases the financial risks.
Before deciding to trade in financial instrument or cryptocurrencies you should be fully informed of the risks and costs associated with trading the financial markets, carefully consider your investment objectives, level of experience, and risk appetite, and seek professional advice where needed.
Fusion Media would like to remind you that the data contained in this website is not necessarily real-time nor accurate. The data and prices on the website are not necessarily provided by any market or exchange, but may be provided by market makers, and so prices may not be accurate and may differ from the actual price at any given market, meaning prices are indicative and not appropriate for trading purposes. Fusion Media and any provider of the data contained in this website will not accept liability for any loss or damage as a result of your trading, or your reliance on the information contained within this website.
It is prohibited to use, store, reproduce, display, modify, transmit or distribute the data contained in this website without the explicit prior written permission of Fusion Media and/or the data provider. All intellectual property rights are reserved by the providers and/or the exchange providing the data contained in this website.
Fusion Media may be compensated by the advertisers that appear on the website, based on your interaction with the advertisements or advertisers.
© 2007-2024 - Fusion Media Limited. All Rights Reserved.