One of the common beliefs of the new normal is the demographic shift to an aging population which does not spend money – lowering the historical GDP potential. This is discussed as being one of the triggers for the Great Recession of 2007. Many forecasters continue to adjust for the headwinds of a demographic shift.
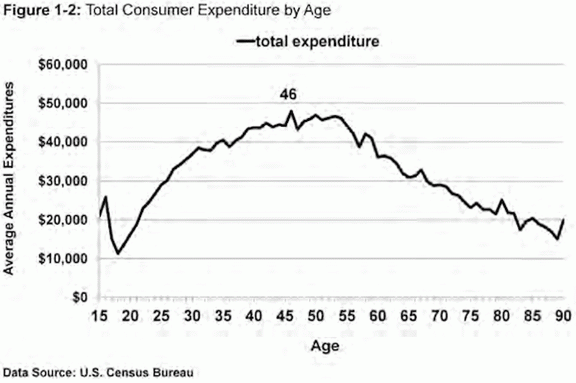
I have from time to time mouthed this opinion , but I now find this premise flawed. In a recent post by John Mauldin included the following graphic (by Harry Dent) showing how the older people spend a lot less than when one is middle aged (incidentally I could not find this data set at the U.S. Census Bureau, but I did find others which shows different methodology and formats but the same basic relative curve – bottom line is that this graph is good for illustration of the different spending levels by age):

We all know about the bulge of baby boomers nearing retirement. It should follow that consumer spending will wither. But this assumption is not true. The total population continues to grow as the baby boomers retire (heavy black line in graph below). Note this data comes from the U.S. Census Bureau forecast of population by age.

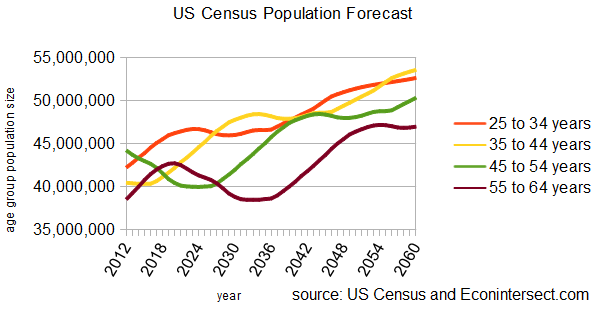
One primary spending age group of 35 to 44 continues to expand every year, while the other primary spending group 45 to 54 contracts until 2026. The graph below expands the detail of the above graph for the age groups from 25 to 64.

There is a slight dip in the 45-54 demographic over the next ten years and a follow-on dip for 55-64 in the years 2020 to 2032, but total population continues to grow and the birthrate projections by the Census Bureau appear to be picking up again starting in about 5-6 years (see the under 25 population curve). Thus the talk of a “demographic cliff” seems to be quite overstating the outlook for the U.S. I have not read Harry Dent’s new book (which uses the term) but it seems to be making an exaggeration in the title: The Demographic Cliff: How to Survive and Prosper During the Great Deflation of 2014-2019. However the subtitle may speak with less over-statement because there is likely to be a demographic component to the economic path between now and 2020. Consider that a major component of deleveraging may be derived from unwinding the over-indulgence in personal debt; the demographic factor may be simply supporting rather than driving.
Because of population growth overall, the demographic shift may not have a noticeable effect on the economy. To demonstrate this graphically, I have used US Census breakdown of 2011 spending by age of the head of the household (see below notation), and loaded the spending data against the US Census population forecast.

In the above graph, the reason the under 25 spending is so small is that the spending data set was based on the household head’s (consumer unit) age. This means the costs for the under 25s are spread to the other age groups because they are not the head of the household unit. This data came with the following notation:
Based on Consumer Expenditure Survey. Data are averages for the noninstitutional population. Expenditures reported here are out of pocket. A consumer unit comprises either: (1) all members of a particular household who are related by blood, marriage, adoption, or other legal arrangements; (2) a person living alone or sharing a household with others or living as a roomer in a private home or lodging house or in permanent living quarters in a hotel or motel, but who is financially independent; or (3) two or more persons living together who pool their income to make joint expenditure decisions. Financial independence is determined by the three major expense categories: Housing, food, and other living expenses. To be considered financially independent, at least two of the three major expense categories have to be provided by the respondent.
My belief that the 2011 US Census Consumer Expenditure Survey is based on very detailed sampling methodology – and should be less distorted by the 1% as it is an average of those surveyed which means it is closer to a median. Therefore, the spending growth presented should be conservative.
The bottom line shows that consumer spending is more sensitive to population growth than demographics.
Other Economic News this Week:
The Econintersect economic forecast for January 2014 predicted a slowing economic growth after several months of increasing growth. What this forecast cannot see is the effect of Obamacare – but slowing of growth in this forecast was primarily the result of the business sector.
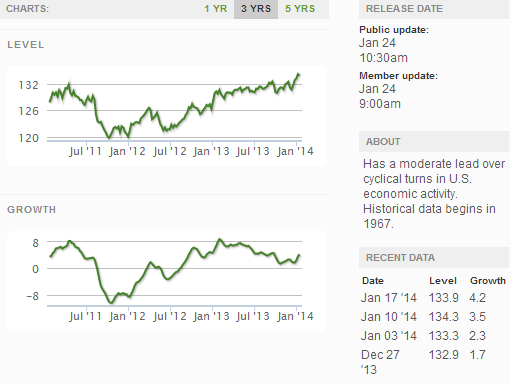
The ECRI WLI growth index value has been weakly in positive territory for over four months – but in a noticeable improvement trend. The index is indicating the economy six month from today will be slightly better than it is today.
Current ECRI WLI Growth Index
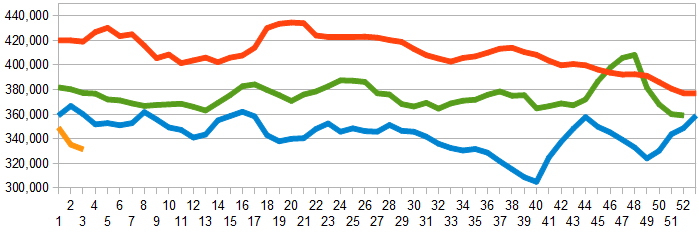
Initial unemployment claims went from 326,000 (reported last week) to 326,000 this week. Historically, claims exceeding 400,000 per week usually occur when employment gains are less than the workforce growth, resulting in an increasing unemployment rate. The real gauge – the 4 week moving average – improved from 335,000 (reported last week) to 331,500. Because of the noise (week-to-week movements from abnormal events AND the backward revisions to previous weeks releases), the 4-week average remains the reliable gauge.
Weekly Initial Unemployment Claims – 4 Week Average – Seasonally Adjusted – 2011 (red line), 2012 (green line), 2013 (blue line), 2014 (orange line)
Bankruptcies this Week: none
Weekly Economic Release Scorecard:
Click here to view the scorecard table below with active hyperlinks


