With the market breaking out to all-time highs, the media has donned its party hat as headlines suggest clear sailing for investors ahead.
After all, why not? We have run one of the longest stretches in history without a 5%, much less a 10% decline. Threats of nuclear war, hurricanes, disaster, fires, earthquakes and civil unrest have failed to unnerve investors. It seems that all that has been missed as of late is famine and pestilence.
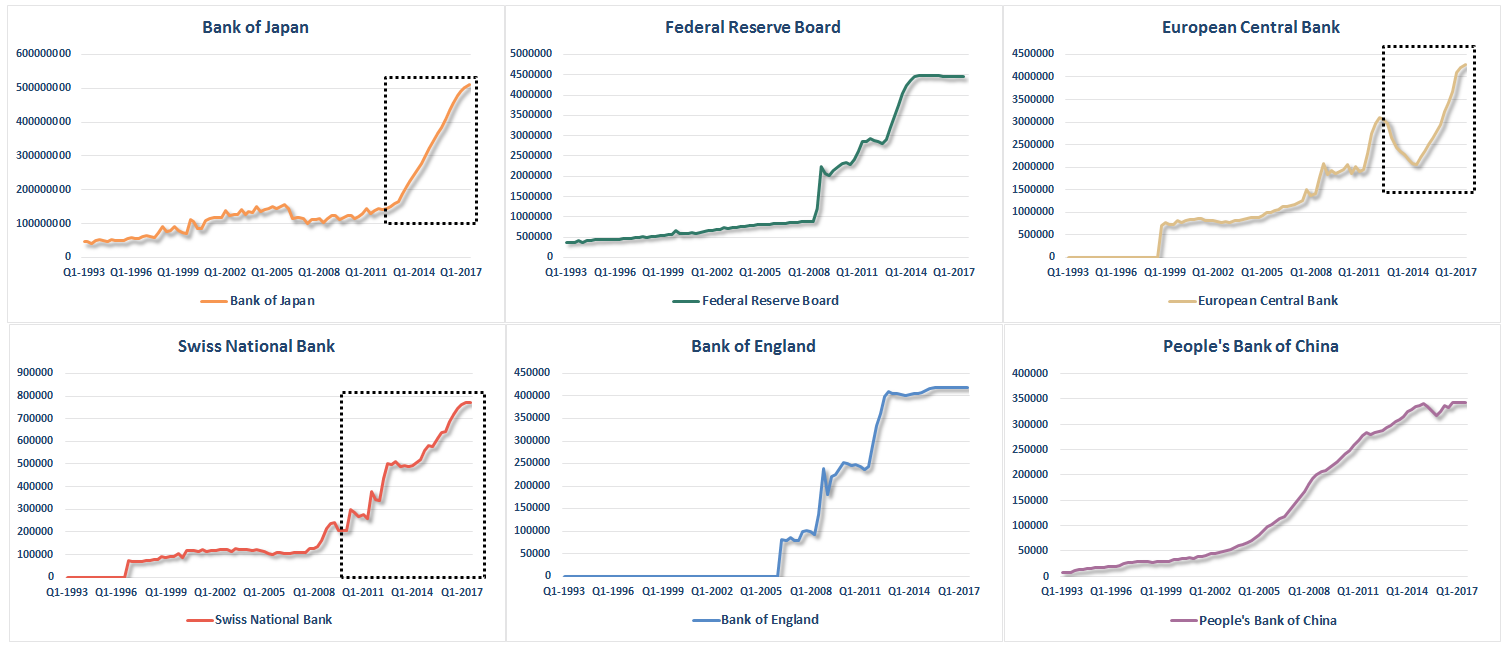
Nonetheless, the breakout is indeed bullish, and signals the continuation of the long-term bullish trend. However, that does not mean there are more than sufficient reasons to remain cautious. As noted on Tuesday, earnings growth remains weak outside of share buybacks, along with top line revenue. There is scant evidence of economic resurgence outside of a restocking cycle bounce, and inflationary pressures globally remain nascent. But such concerns, and I am not even sure the “4-horseman of the apocalypse” would make a difference, are “trumped,” by the ongoing global central bank interventions.
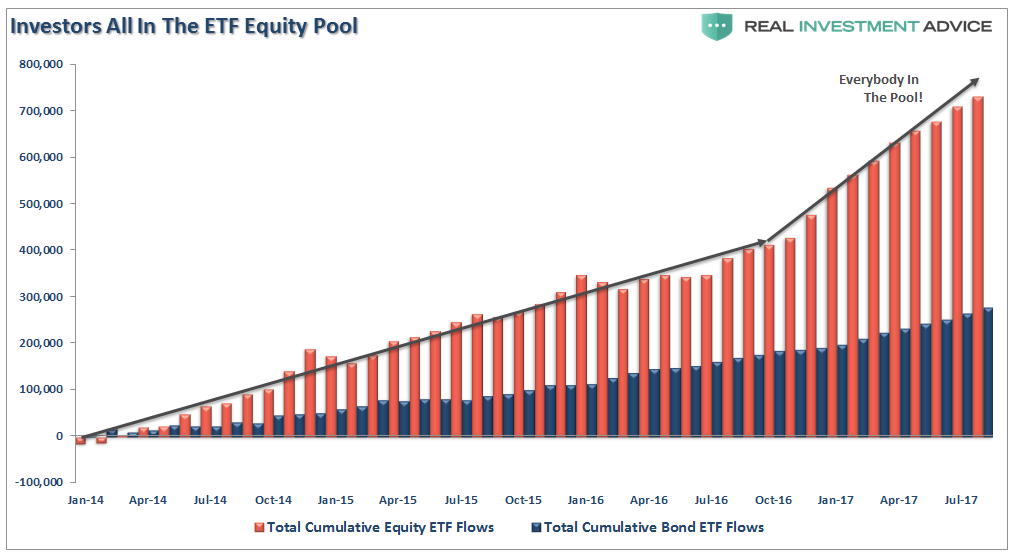
Not surprisingly, while it took individuals time to develop their “Pavlovian” response to the ringing of the “BTFD” bell, they have now fully complied as measured by the Investment Company Institute (ICI).
As shown in the chart above, as asset prices have escalated, so have individual appetites to chase risk. The herding into equity ETFs suggest that investors have simply thrown caution to the wind.
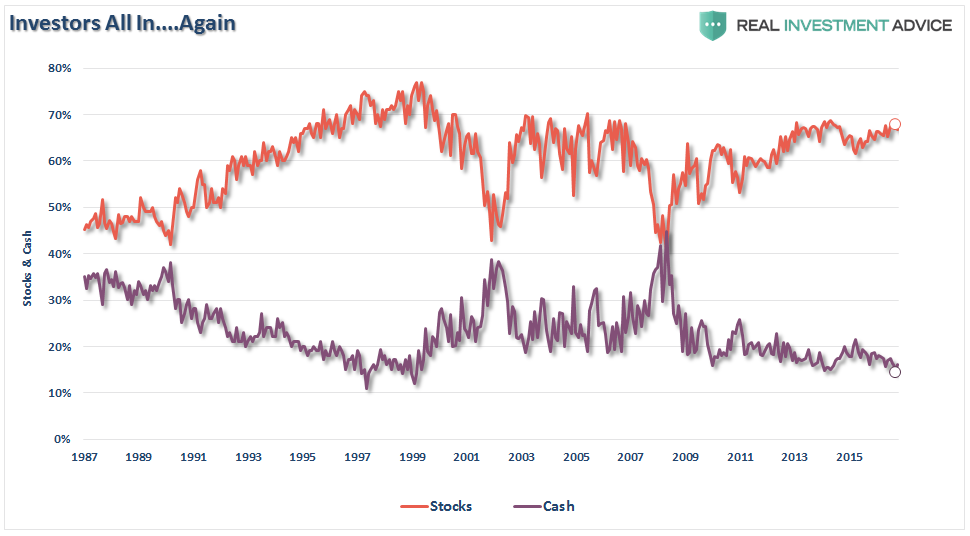
The same can be seen for the American Association of Individual Investors as shown below.
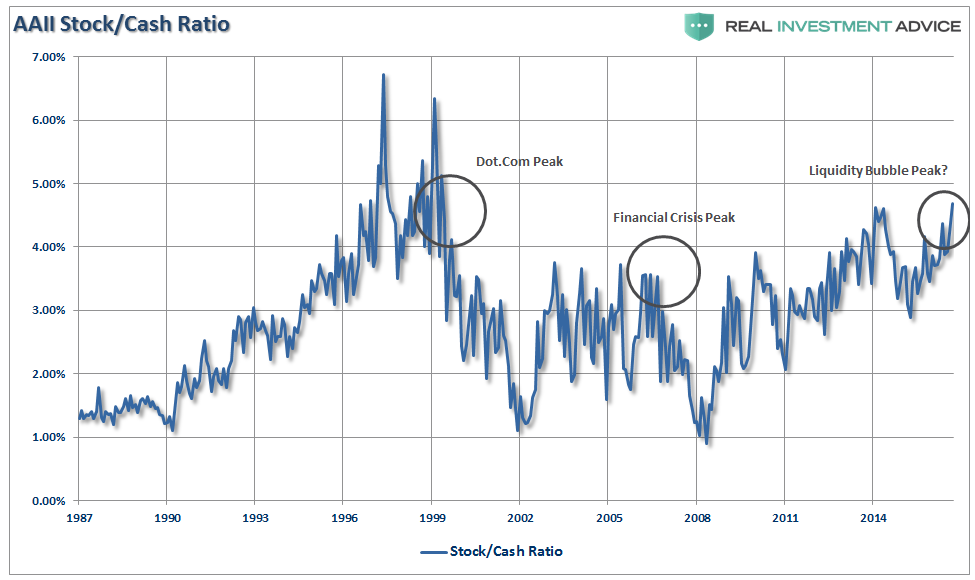
While the ICI chart above shows “net flows,” the AAII chart shows percentage allocated to stocks versus cash. With cash levels at the lowest level since 1997, and equity allocations near the highest levels since 1999 and 2007, it also suggests investors are now functionally “all in.”
With net exposure to equity risk by individuals at historically high levels, it suggests two things:
- There is little buying left from individuals to push markets marginally higher, and;
- The stock/cash ratio, shown below, is at levels normally coincident with more important market peaks.
Here is the point, despite ongoing commentary about mountains of “cash on the sidelines,” this is far from the case. This leaves the current advance in the markets almost solely in the realm of Central Bank activity.
Of course, there is nothing wrong with that…until there is.
Which brings us to the ONE question everyone should be asking.
If the markets are rising because of expectations of improving economic conditions and earnings, then why are Central Banks pumping liquidity like crazy?
Despite the best of intentions, central-bank interventions, while boosting asset prices may seem like a good idea in the short-term, in the long term has had a negative impact on economic growth. As such, it leads to the repetitive cycle of monetary policy.
- Using monetary policy to drag forward future consumption leaves a larger void in the future that must be continually refilled.
- Monetary policy does not create self-sustaining economic growth and therefore requires ever larger amounts of monetary policy to maintain the same level of activity.
- The filling of the “gap” between fundamentals and reality leads to consumer contraction and ultimately a recession as economic activity recedes.
- Job losses rise, wealth effect diminishes and real wealth is destroyed.
- Middle class shrinks further.
- Central banks act to provide more liquidity to offset recessionary drag and restart economic growth by dragging forward future consumption.
- Wash, Rinse, Repeat.
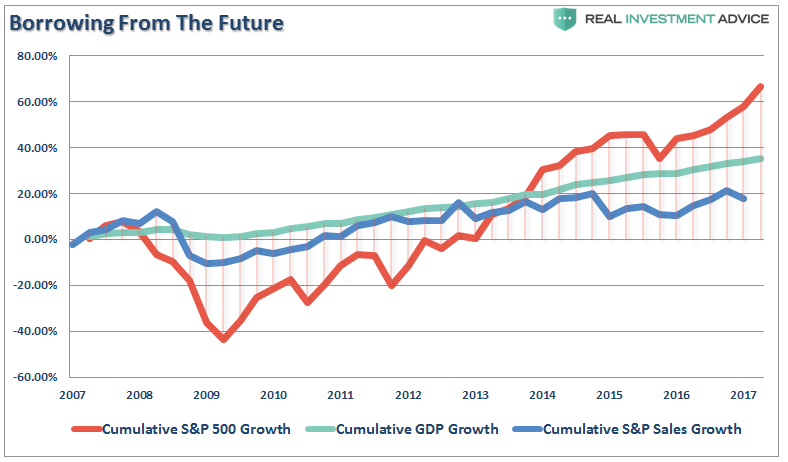
If you don’t believe me, here is the evidence.
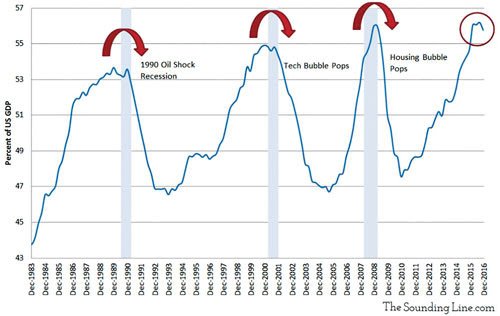
The stock market has returned more than 60% since the 2007 peak, which is more than three times the growth in corporate sales growth and 30% more than GDP. The all-time highs in the stock market have been driven by the $4.5 trillion increase in the Fed’s balance sheet, hundreds of billions in stock buybacks, PE expansion and ZIRP.
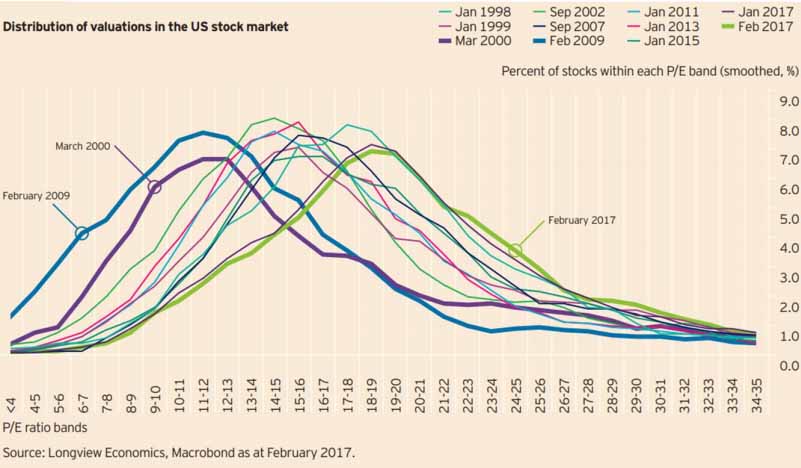
In turn, this has driven the average valuation of stocks to the highest ratio in history.
Which, as noted, has been driven by a debt-driven binge of share repurchases to boost bottom line earnings.
What could possibly go wrong?
However, whenever there is a discussion of valuations, it is invariably stated that “low rates justify higher valuations.”
Maybe. But the argument suggests rates are low BECAUSE the economy is healthy and operating near full capacity. However, the reality is quite different as the always insightful Dr. John Hussman pointed out this past week:
Make no mistake: the main contributors to the illusion of permanent prosperity have been decidedly cyclical factors.
Again, when interest rates are low because growth is also low, no valuation premium is ‘justified’ at all. In the present environment, investors are inviting disastrous losses by paying the highest S&P 500 price/revenue ratio in history (outside of the single week of the 2000 market high) and the highest median price/revenue ratio in history across S&P 500 component stocks (more than 50% beyond the 2000 peak, because extreme valuations in that episode were focused on much narrower subset of stocks than at present). Glorious past returns and record valuations are a Potemkin Village with a barren field behind it.
There are virtually no measures of valuation which suggest making investments today, and holding them for the next 20-30 years, will work to any great degree.
That is just the math.
Which brings me to something Michael Sincere’s once penned:
At market tops, it is common to see what I call the ‘high-five effect’ — that is, investors giving high-fives to each other because they are making so much paper money. It is happening now. I am also suspicious when amateurs come out of the woodwork to insult other investors.
Michael’s point is very apropos, particularly today. It is interesting that prior to the election the majority of analysts, media and investors were “certain” the market would crash if Trump was elected. Since the election, it’s “high-fives and pats on the back.”
While nothing has changed, the confidence of individuals and investors has surged. Of course, as the markets continue their relentless rise, investors begin to feel “bullet proof” as investment success breeds over-confidence.
The reality is that strongly rising asset prices, particularly when driven by emotional exuberance, “hides” investment mistakes in the short term. Poor, or deteriorating, fundamentals, excessive valuations and/or rising credit risk is often ignored as prices increase. Unfortunately, it is only after the damage is done that the realization of those “risks” occurs.
As Michael stated:
Most investors believe the Fed will protect their investments from any and all harm, but that cannot go on forever. When the Fed attempts to extricate itself from the market one day, that is when the music stops, and the blame game begins.
In the end, it is crucially important to understand that markets run in full cycles (up and down). While the bullish “up” cycle lasts twice as long as the bearish “down” cycle, the damage to investors is not a result of lagging markets as they rise, but in capturing the inevitable reversion. This is something I discussed in “Bulls And Bears Are Both Broken Clocks:”
In the end, it does not matter IF you are ‘bullish’ or ‘bearish.’ The reality is that both ‘bulls’ and ‘bears’ are owned by the ‘broken clock’ syndrome during the full-market cycle. However, what is grossly important in achieving long-term investment success is not necessarily being ‘right’ during the first half of the cycle, but by not being ‘wrong’ during the second half.
The markets are indeed in a liquidity-driven up cycle currently. With margin debt near peaks, stock prices in a near vertical rise and “junk bond yields” near record lows, the bullish media continues to suggest there is no reason for concern.
The support of liquidity is being extracted by the Federal Reserve as they simultaneously tighten monetary policy by raising interest rates. Those combined actions, combined with excessive exuberance and risk taking, have NEVER been good for investors over the long term.
At market peaks – “everyone’s in the pool.”

