Many of the leading European banks are now diverging from the U.S. banks, the three leading European banks are all trading under the daily chart 200 moving average, which is a sign of weak relative strength for the European bank stocks. The opposite is true for the U.S. banks, as J.P. Morgan Chase & co (NYSE:JPM), Bank of America Corp (NYSE:BAC), and Wells Fargo & Co (NYSE:WFC) are all trading above the daily chart 50, and 200 moving averages, which is a sign of strength on the charts.
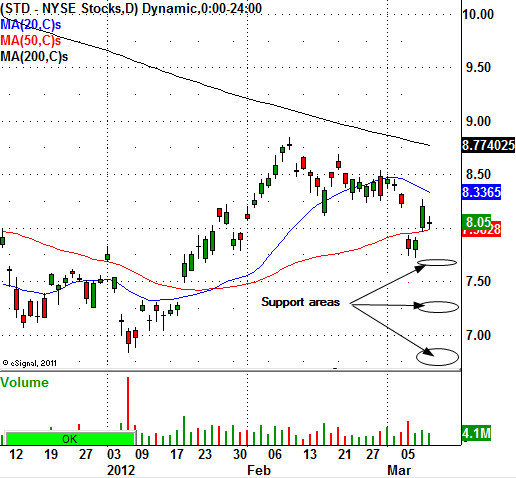
Banco Santander SA (NYSE:STD) is a leading Spanish bank that operates throughout Europe, Latin America, and the United States. Last week, the stock closed at $8.05 a share which is 0.70 cents below its daily chart 200 moving average. It is also important to note that the stock is trading below its October 2011 high of $9.32 a share. The STD stock will have short term support around the $7.65, and $6.75 levels. Should the leading Spanish bank rally from current levels the stock will have daily chart resistance around the $8.77, and $9.50 levels. Take careful note of these levels, place them on your charts and trade them accordingly. 
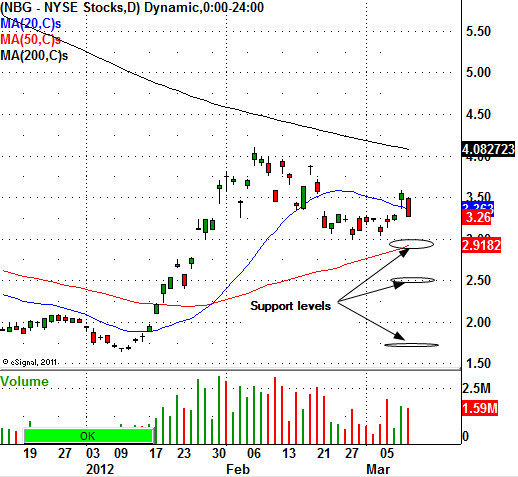
The National Bank of Greece SA (NYSE:NBG) is another leading European bank that looks terrible on the charts. Last week, NBG stock closed at $3.26 a share. NBG stock is also trading below the important daily chart 200 moving average. This pattern puts the stock in a week technical position on the charts. Traders and investors should watch for near term daily chart support around the $2.90, $2.50, and $1.70 levels. Should the stock trade higher and rally from its current price, their will be resistance around the $4.10, and $4.50 levels.
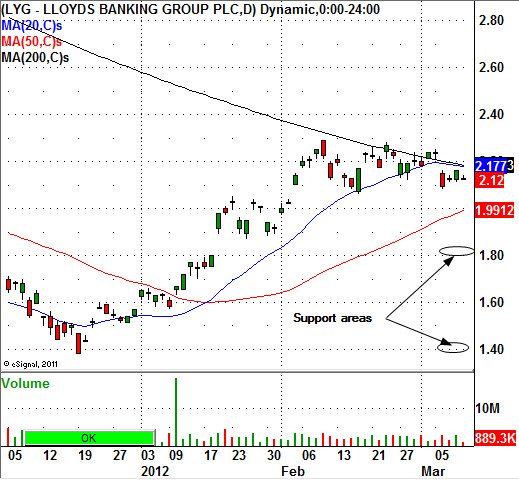
Lloyds banking Group plc (NYSE:LYG) is a leading bank based out of the United Kingdom. This stock closed at $2.12 on March 9, 2012. Believe it or not, this stock could be forming a base to actually trade higher in the future. Please note that the stock is still trading below the daily chart 200 moving average which signals poor relative strength when compared to the major stock indexes in the United States. LYG stock has very good support around the $1.80, and $1.40 levels. Should the stock rally from its current price there will be resistance around the $2.40, and $2.85 levels.
Take careful note of these levels, understand what moves the the bank stocks and profit from the relationship. 
- English (UK)
- English (India)
- English (Canada)
- English (Australia)
- English (South Africa)
- English (Philippines)
- English (Nigeria)
- Deutsch
- Español (España)
- Español (México)
- Français
- Italiano
- Nederlands
- Português (Portugal)
- Polski
- Português (Brasil)
- Русский
- Türkçe
- العربية
- Ελληνικά
- Svenska
- Suomi
- עברית
- 日本語
- 한국어
- 简体中文
- 繁體中文
- Bahasa Indonesia
- Bahasa Melayu
- ไทย
- Tiếng Việt
- हिंदी
European Debt Crisis: Here Is The Trade
Published 03/12/2012, 12:28 PM
Updated 07/09/2023, 06:31 AM
European Debt Crisis: Here Is The Trade
Latest comments
Loading next article…
Install Our App
Risk Disclosure: Trading in financial instruments and/or cryptocurrencies involves high risks including the risk of losing some, or all, of your investment amount, and may not be suitable for all investors. Prices of cryptocurrencies are extremely volatile and may be affected by external factors such as financial, regulatory or political events. Trading on margin increases the financial risks.
Before deciding to trade in financial instrument or cryptocurrencies you should be fully informed of the risks and costs associated with trading the financial markets, carefully consider your investment objectives, level of experience, and risk appetite, and seek professional advice where needed.
Fusion Media would like to remind you that the data contained in this website is not necessarily real-time nor accurate. The data and prices on the website are not necessarily provided by any market or exchange, but may be provided by market makers, and so prices may not be accurate and may differ from the actual price at any given market, meaning prices are indicative and not appropriate for trading purposes. Fusion Media and any provider of the data contained in this website will not accept liability for any loss or damage as a result of your trading, or your reliance on the information contained within this website.
It is prohibited to use, store, reproduce, display, modify, transmit or distribute the data contained in this website without the explicit prior written permission of Fusion Media and/or the data provider. All intellectual property rights are reserved by the providers and/or the exchange providing the data contained in this website.
Fusion Media may be compensated by the advertisers that appear on the website, based on your interaction with the advertisements or advertisers.
© 2007-2024 - Fusion Media Limited. All Rights Reserved.
