Get 40% Off
These stocks are up over 10% post earnings. Did you spot the buying opportunity? Our AI did.Read how

EUR/NZD Stays Above An Upside Support Line

Published 05/18/2022, 08:20 AM
Updated 07/09/2023, 06:31 AM

EUR/NZD traded higher yesterday, after it hit support at 1.6455, near the upside support line drawn from the low of Apr. 5. However, the advance remained limited near the 1.6620 level, and then, the pair retreated somewhat.

Overall though, EUR/NZD remains above an upside support line drawn from the low of Apr. 5, and thus, we would still see chances for the bulls to take charge again at some point soon.

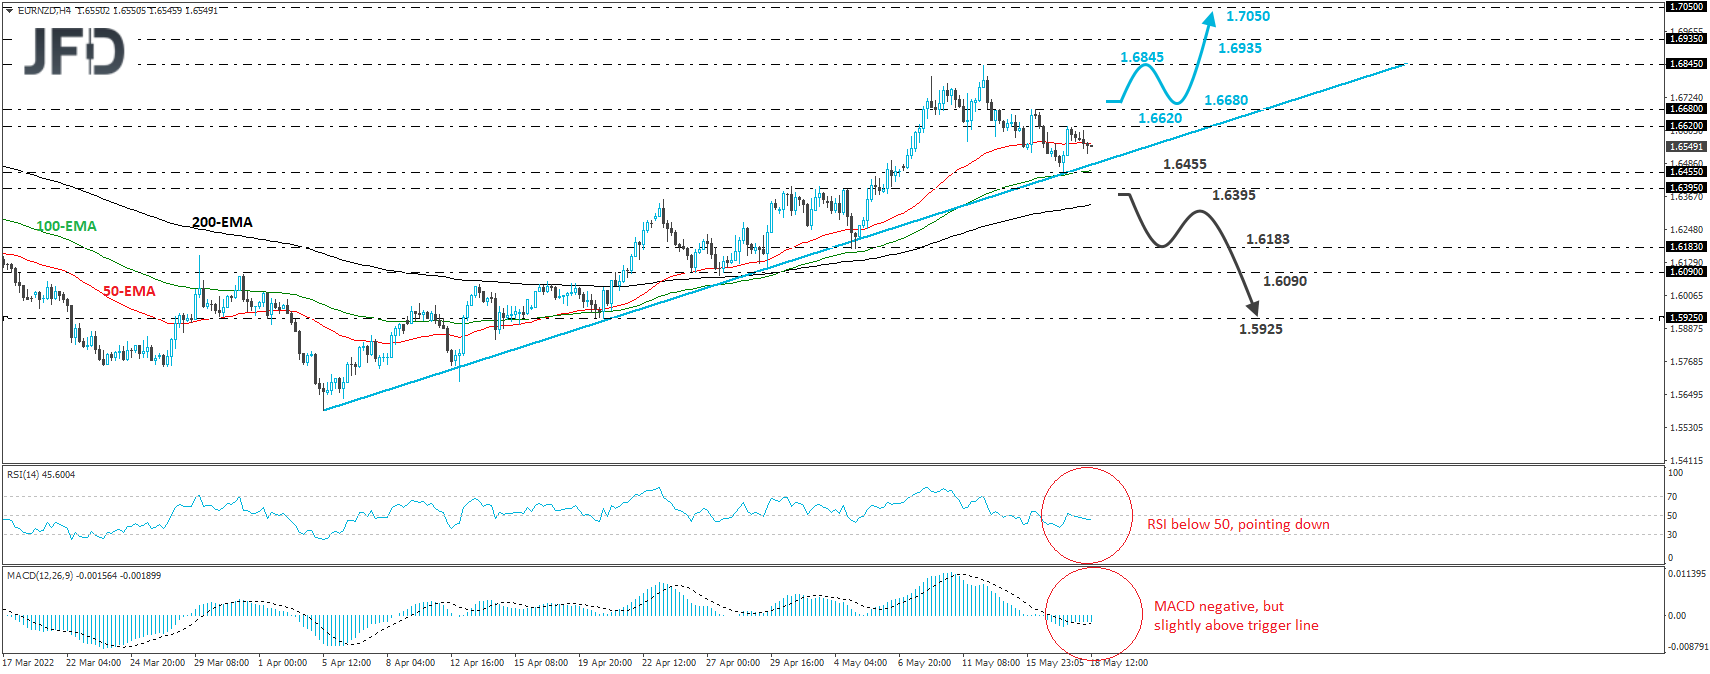
A clear break above 1.6680 could confirm a trend continuation and may initially pave the way towards the peak of May 12, at 1.6845. If that zone doesn’t hold, then its break will confirm a forthcoming higher high and could aim for the high of Feb. 21, at 1.6935.

Another break, above 1.6935, could carry extensions towards the 1.7050 zone, which is marked as a resistance by the inside swing lows of Feb. 14 and 15.

Taking a look at our short-term oscillators, we see that the RSI lies below 50 and points down, while the MACD, although it now lies above its trigger line, it remains within the negative zone.

Both indicators still detect negative momentum, and that’s another reason why we prefer to wait for a break above 1.6680 before we get confident on another round of strong buying.

On the downside, we would like to see a clear dip below 1.6395 before we start examining a bearish reversal. The rate will already be below the upside support line taken from the low of Apr. 5, and we may see initial declines towards the low of May 4, at 1.6183.

3rd party Ad. Not an offer or recommendation by Investing.com. See disclosure here or remove ads .

Another break, below 1.6183, could aim for the 1.6090 zone, which provided support on Apr. 26 and 27. Now, if the bears are not willing to give up there either, then we may see them diving all the way down to the low of Apr. 20, at 1.5925.
EUR/NZD 4-hour chart technical analysis

Latest comments

thanks
Risk Disclosure: Trading in financial instruments and/or cryptocurrencies involves high risks including the risk of losing some, or all, of your investment amount, and may not be suitable for all investors. Prices of cryptocurrencies are extremely volatile and may be affected by external factors such as financial, regulatory or political events. Trading on margin increases the financial risks.
Before deciding to trade in financial instrument or cryptocurrencies you should be fully informed of the risks and costs associated with trading the financial markets, carefully consider your investment objectives, level of experience, and risk appetite, and seek professional advice where needed.
Fusion Media would like to remind you that the data contained in this website is not necessarily real-time nor accurate. The data and prices on the website are not necessarily provided by any market or exchange, but may be provided by market makers, and so prices may not be accurate and may differ from the actual price at any given market, meaning prices are indicative and not appropriate for trading purposes. Fusion Media and any provider of the data contained in this website will not accept liability for any loss or damage as a result of your trading, or your reliance on the information contained within this website.
It is prohibited to use, store, reproduce, display, modify, transmit or distribute the data contained in this website without the explicit prior written permission of Fusion Media and/or the data provider. All intellectual property rights are reserved by the providers and/or the exchange providing the data contained in this website.
Fusion Media may be compensated by the advertisers that appear on the website, based on your interaction with the advertisements or advertisers.
© 2007-2024 - Fusion Media Limited. All Rights Reserved.