
Are Bulls Back In Play Again?
Despite early bearish push on Boxing Day, prices recovered rather quickly, pushing above Christmas Eve's closing level during early European hours. The rally then was was certainly inexplicable considering that all the major European trading centres are closed, and there weren't any major news being reported either. Hence, this bullish push could be classified under "holiday volatility" where price just move in seemingly random fashion without strong directional follow-through. Considering that the bullish push didn't manage to stay above 1.37 not to mention the recent swing high of 1.3717, yesterday's assertion that bearish pressure remain in play was intact.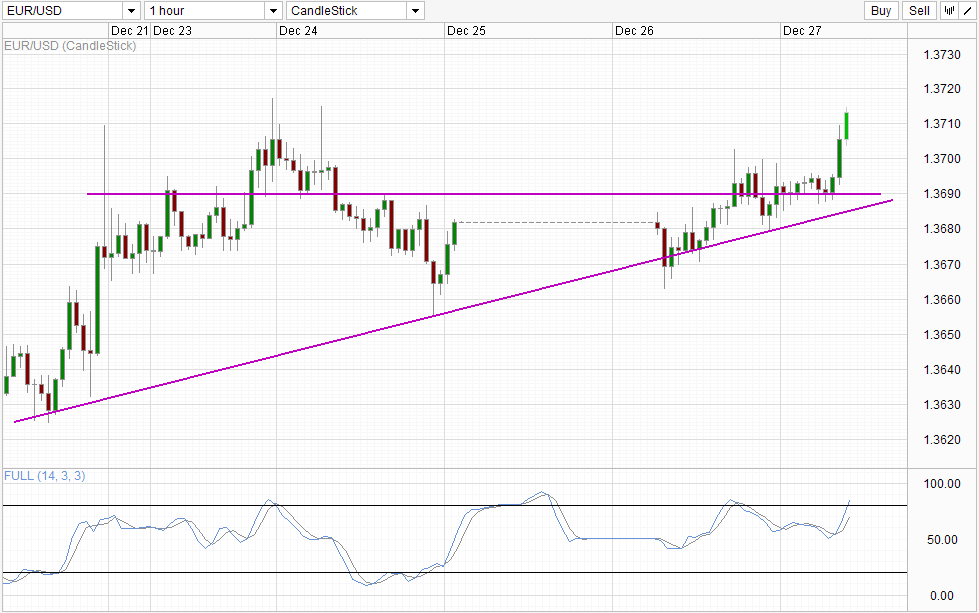 EUR/USD: Hourly" title="EUR/USD: Hourly" height="613" width="979">
That assertion was still correct until prices suddenly rally a couple of hours ago though. The break of 1.37 changes the immediate S/T bias and invalidates the decline that started on 23rd Dec. Instead, initiative is given to bullish momentum and the rising trendline starting from last Friday enters into focus. However. we're having no discernible reason why prices are rallying once again. There are good economic data released earlier from both Japan and China, but that should hardly impact EUR. Furthermore, risk appetite in Asia is hardly the most bullish with Nikkei 225 trading lower, hence it is difficult to see why a risk currency like EUR will rally. Also, other risk currencies such as AUD/USD, NZD/USD and GBP/USD are not exhibiting similar rallies currently, suggesting that EUR/USD may be inherently bullish.
Hence, even though 1.3717 should provide adequate resistance that will send EUR/USD packing lower, especially given that Stochastic readings are already in Overbought region, we should not put it past bulls to break the aforementioned resistance and initiate a fresh S/T bullish extension given the peculiarity. Bottomline? This is not a strong bullish setup but selling into this rally may be risky as well.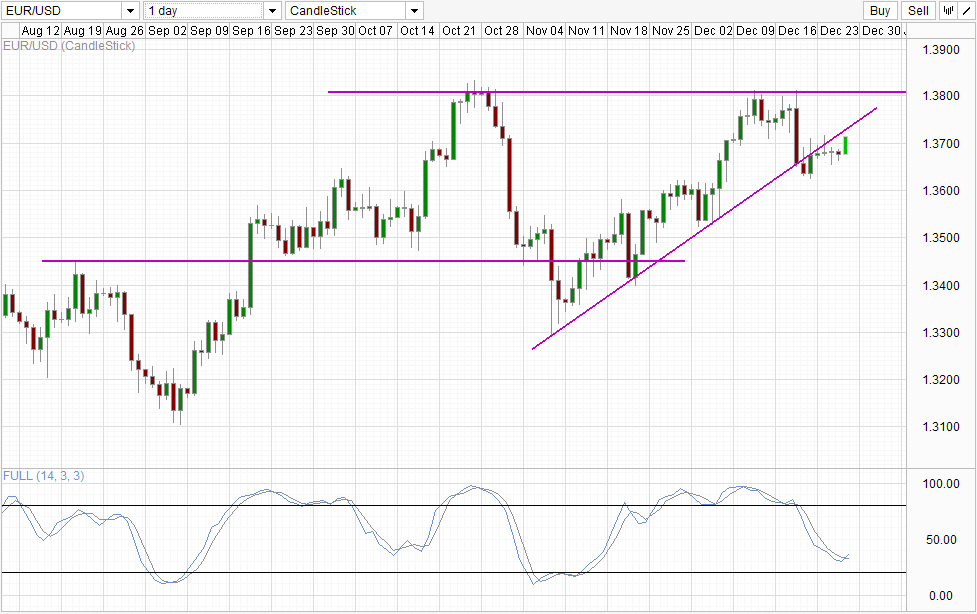 EUR/USD: Daily" title="EUR/USD: Daily" height="613" width="979">
Looking at Daily Chart, we can see that overall bearish bias remain in play but we are on the verge of breaking that if bulls are able to climb above the rising trendline and enter into the 1.374 - 1.382 consolidation zone. Stochastic readings have bottomed out and a bullish cycle may well be in play here. But traders need to be aware of the risk/reward ratio if they go in long from here. Right now, there is very little evidence that price may break above 1.382 quickly, and we may see strong rebounds coming should 1.382 holds. On the other hand, the Double Top pattern may well send prices much lower with 1.36 the closest significant support. If bullish traders are comfortable with this, then go ahead.
Original post
- English (UK)
- English (India)
- English (Canada)
- English (Australia)
- English (South Africa)
- English (Philippines)
- English (Nigeria)
- Deutsch
- Español (España)
- Español (México)
- Français
- Italiano
- Nederlands
- Português (Portugal)
- Polski
- Português (Brasil)
- Русский
- Türkçe
- العربية
- Ελληνικά
- Svenska
- Suomi
- עברית
- 日本語
- 한국어
- 简体中文
- 繁體中文
- Bahasa Indonesia
- Bahasa Melayu
- ไทย
- Tiếng Việt
- हिंदी
EUR/USD Technicals
ByMarketPulse
AuthorMingze Wu
Published 12/27/2013, 12:57 AM
Updated 03/05/2019, 07:15 AM
EUR/USD Technicals
3rd party Ad. Not an offer or recommendation by Investing.com. See disclosure here or
remove ads
.
Latest comments
Install Our App
Risk Disclosure: Trading in financial instruments and/or cryptocurrencies involves high risks including the risk of losing some, or all, of your investment amount, and may not be suitable for all investors. Prices of cryptocurrencies are extremely volatile and may be affected by external factors such as financial, regulatory or political events. Trading on margin increases the financial risks.
Before deciding to trade in financial instrument or cryptocurrencies you should be fully informed of the risks and costs associated with trading the financial markets, carefully consider your investment objectives, level of experience, and risk appetite, and seek professional advice where needed.
Fusion Media would like to remind you that the data contained in this website is not necessarily real-time nor accurate. The data and prices on the website are not necessarily provided by any market or exchange, but may be provided by market makers, and so prices may not be accurate and may differ from the actual price at any given market, meaning prices are indicative and not appropriate for trading purposes. Fusion Media and any provider of the data contained in this website will not accept liability for any loss or damage as a result of your trading, or your reliance on the information contained within this website.
It is prohibited to use, store, reproduce, display, modify, transmit or distribute the data contained in this website without the explicit prior written permission of Fusion Media and/or the data provider. All intellectual property rights are reserved by the providers and/or the exchange providing the data contained in this website.
Fusion Media may be compensated by the advertisers that appear on the website, based on your interaction with the advertisements or advertisers.
© 2007-2024 - Fusion Media Limited. All Rights Reserved.