Deutsche Bank (NYSE:DB) predicts 0.9500 for EUR/USD by the end of 2017. According to Goldman Sachs (NYSE:GS), the Euro will reach parity with the US dollar in 2017. With EUR USD in a state of “free fall” now, the big financial institutions are probably right to expect more weakness. But aren’t they too pessimistic?
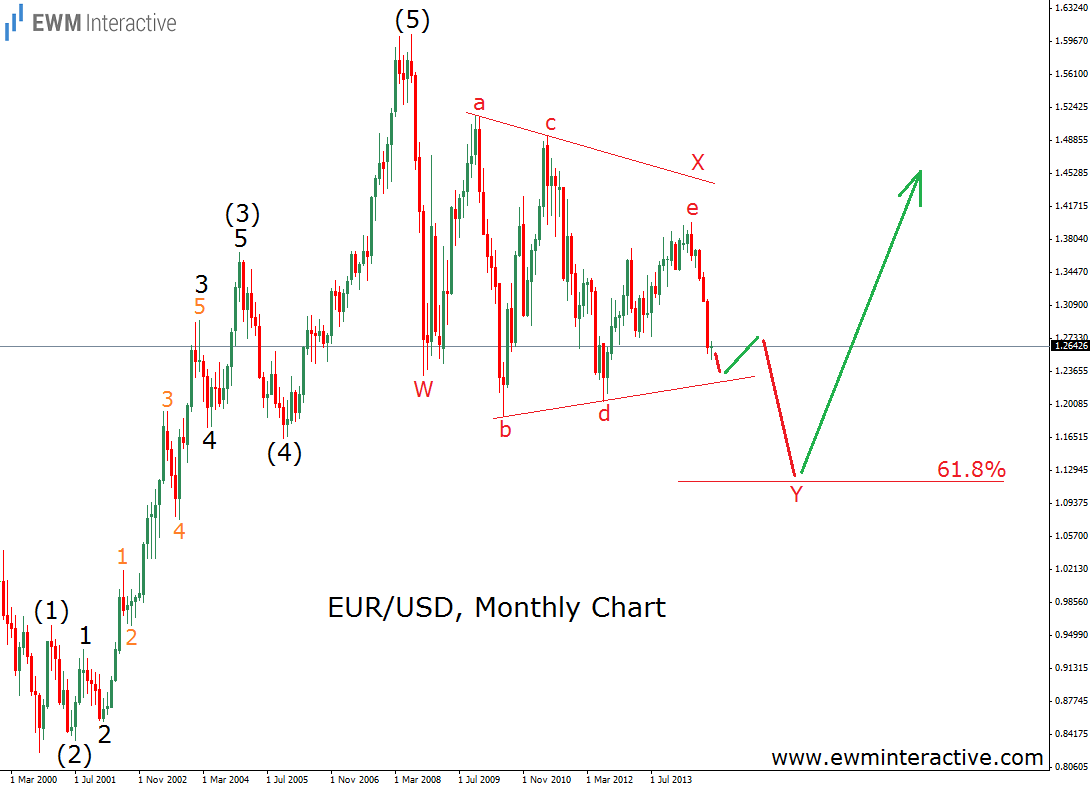
Since we have already shown you an hourly, a daily and a weekly chart of EUR/USD, time has come to show you a monthly one with a long term forecast based on it. We are allowed to do that because of the fractal nature of the markets, where each pattern can be found on all degrees of trend, regardless of how big or small. In this case we will try to recognize an Elliott Wave pattern, which has been forming for more than a decade. The chart below takes us back to the year 2000 to see how the Euro has been trading against the US dollar for the last 14 years.
There it is. It turns out that the big bull trend from 0.8225 in 2000 to 1.6038 in 2008 is impulsive, which means in five waves, labeled (1)-(2)-(3)-(4)-(5). Every Elliottician knows, that after every five-wave sequence there should be a three-wave correction in the opposite direction. In our opinion, this is exactly what EUR/USD is involved in since July 2008. To be more precise, this bear market looks like an unfinished double zig-zag retracement so far, labeled W-X-Y, where wave X takes the form of a triangle. According to the Elliott Wave Principle, triangles precede the final movement of the larger sequence. In this situation the final movement is wave Y of a W-X-Y correction. So, five waves up, followed by three waves down forms a complete 5-3 Elliott Wave cycle, which means that we should expect the exchange rate to resume its uptrend as soon as wave Y is over. What does this mean in terms of price? Note that 61.8% Fibonacci level standing right in EUR/USD’s path at 1.12. That is the area, where we would be expecting the last bottom to form – between 1.15 and 1.10. If this is the correct count, the next one year is not supposed to cheer the bulls up, they will probably have to wait a while. However, our forecast is much more optimistic than the predictions of the big institutions.
Six months ago, when EUR/USD soared towards 1.40, they were extremely bullish, saying it will reach 1.45 and even 1.55. Now the Euro is falling and they are on the exact opposite pole of emotions – extremely bearish. And this is quite normal. See, the majority’s forecasts is nothing more than trend following. If the trend is up, they are bullish. If it is down – bearish. In our opinion, this is not a forecast at all. Making a forecast carries a significant risk of being wrong, which they are obviously not willing to take. Extrapolating the current trend to infinity is much more safer. But no trend lasts forever. A reversal would inevitably happen and if you are not prepared for it, you might get hurt. That is what we are trying to avoid.
